Reports
Reading guide
Reading a detailed report can be difficult, especially with all the figures and complex data. This 3-step guide is here to help you understand the report and learn the real facts about the flights around you.
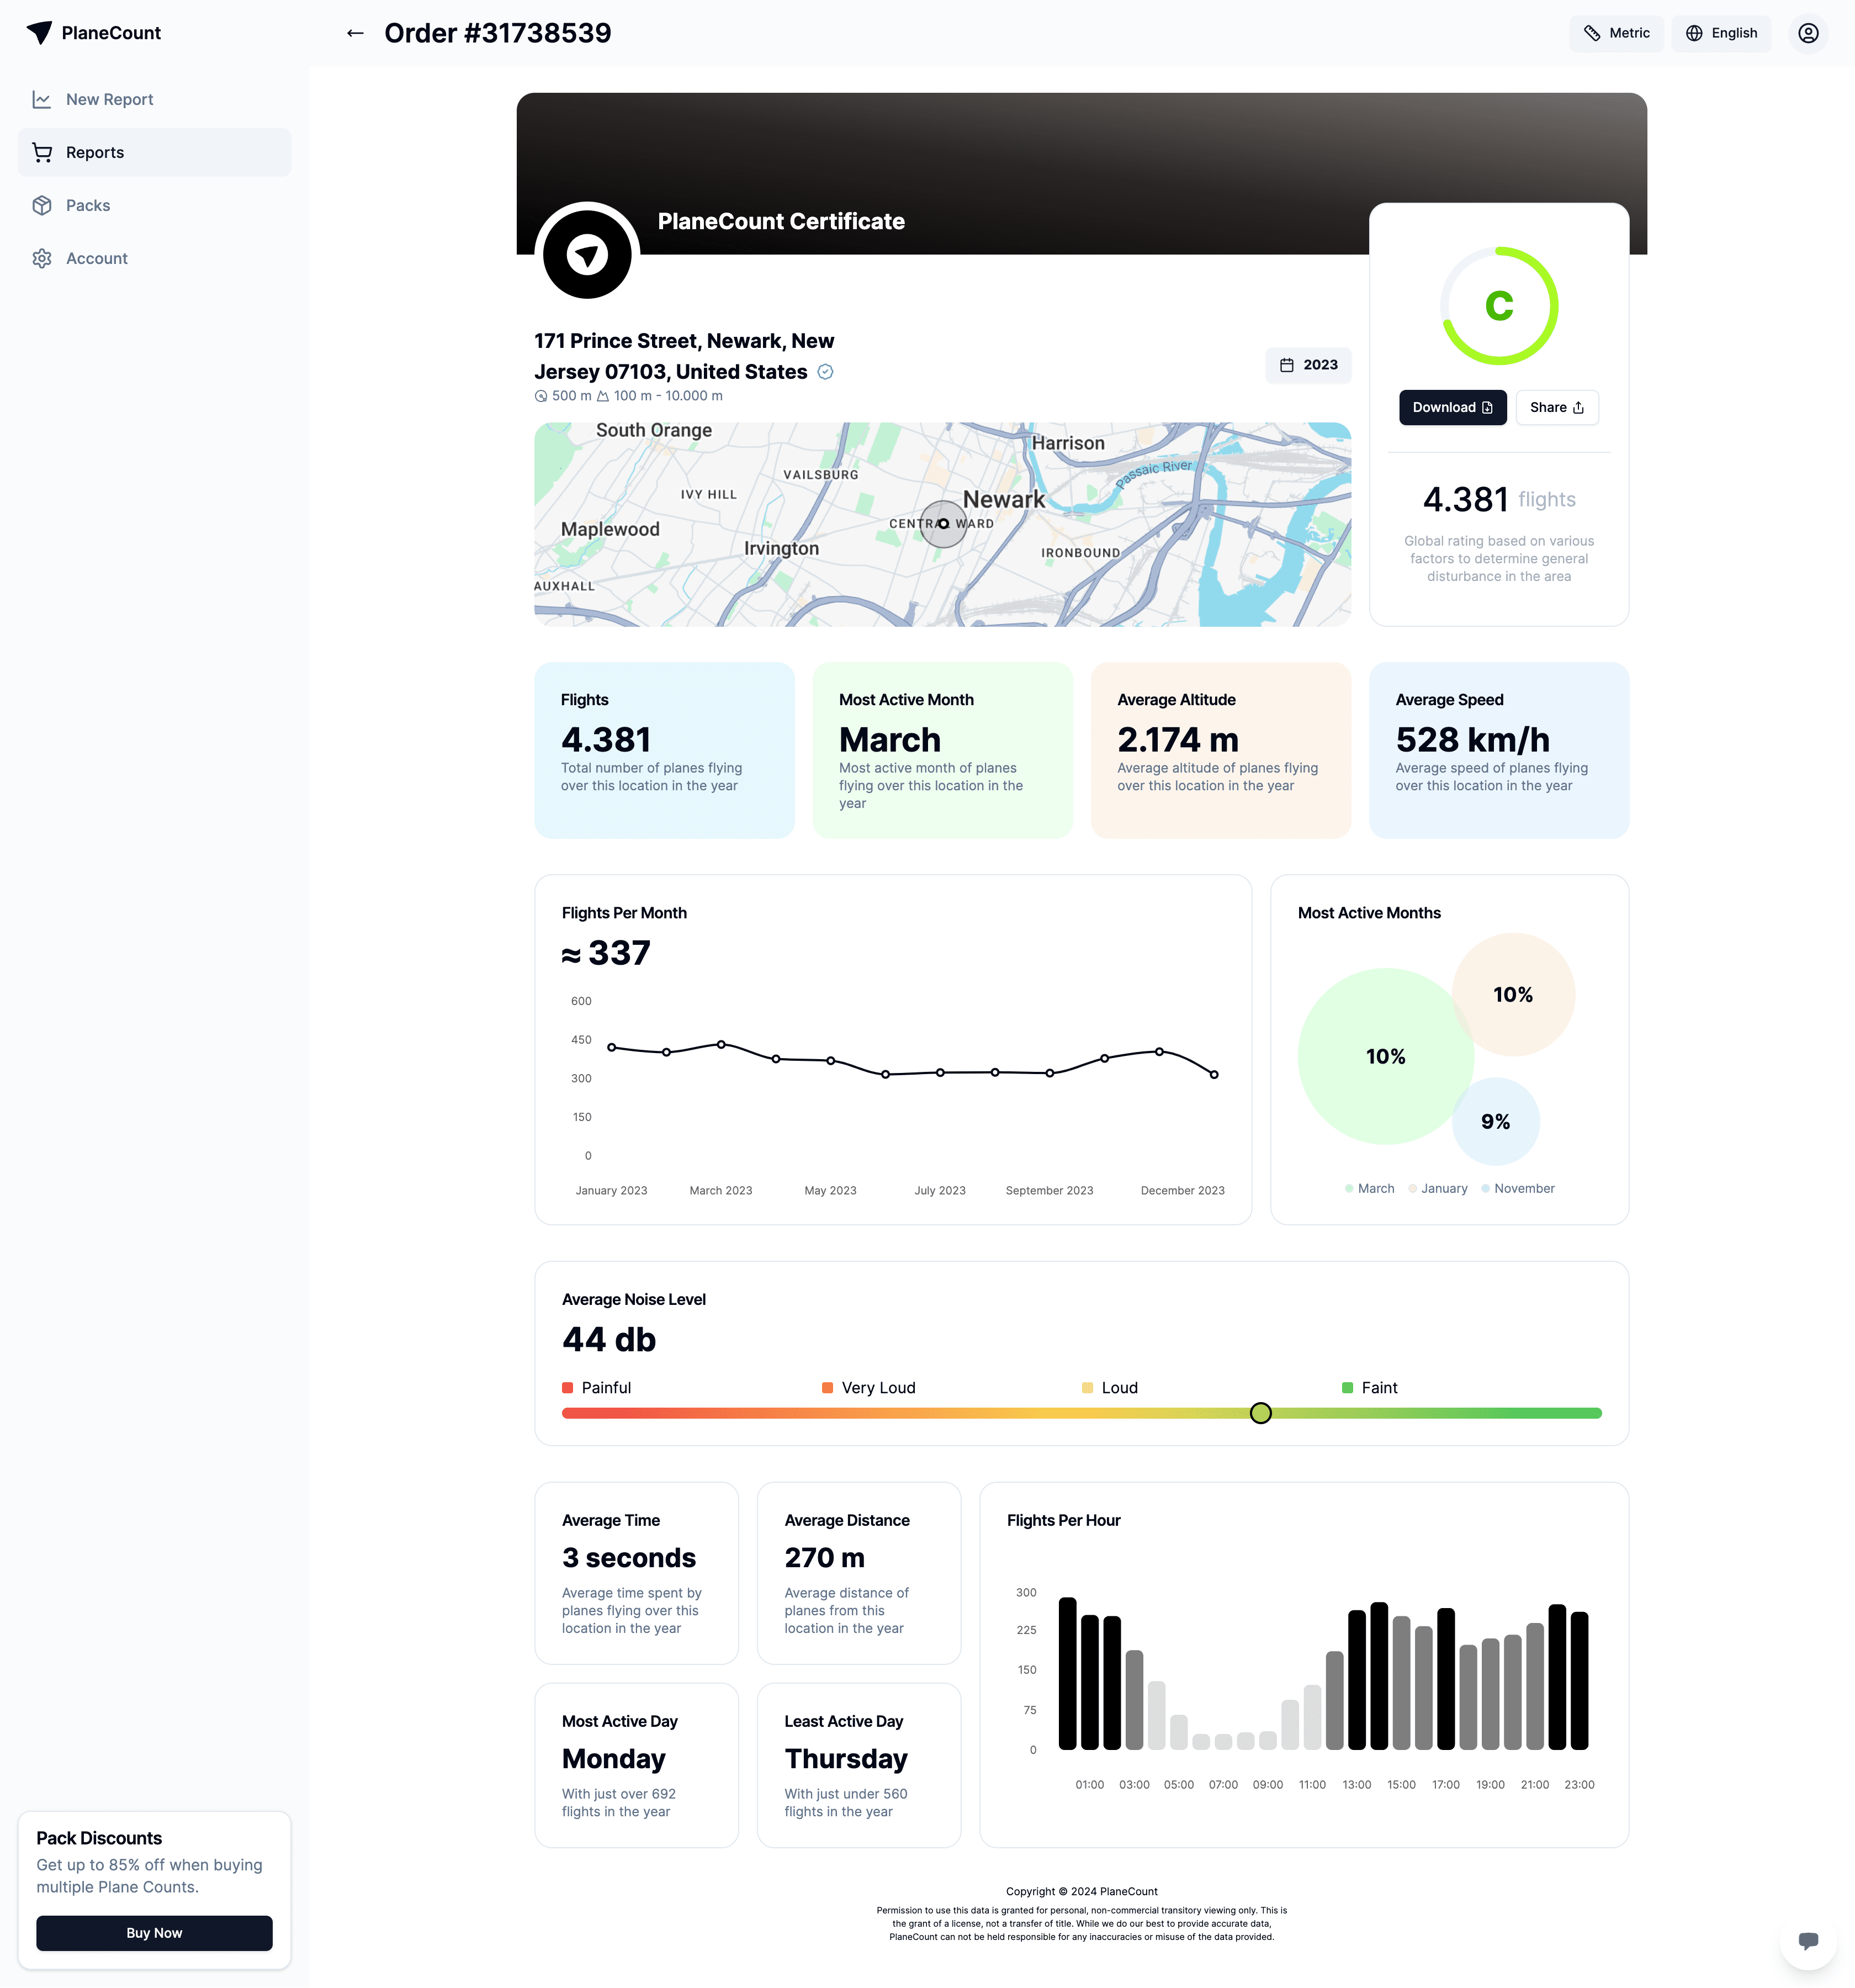
Report parameters
Discover where and how the report parameters are displayed.
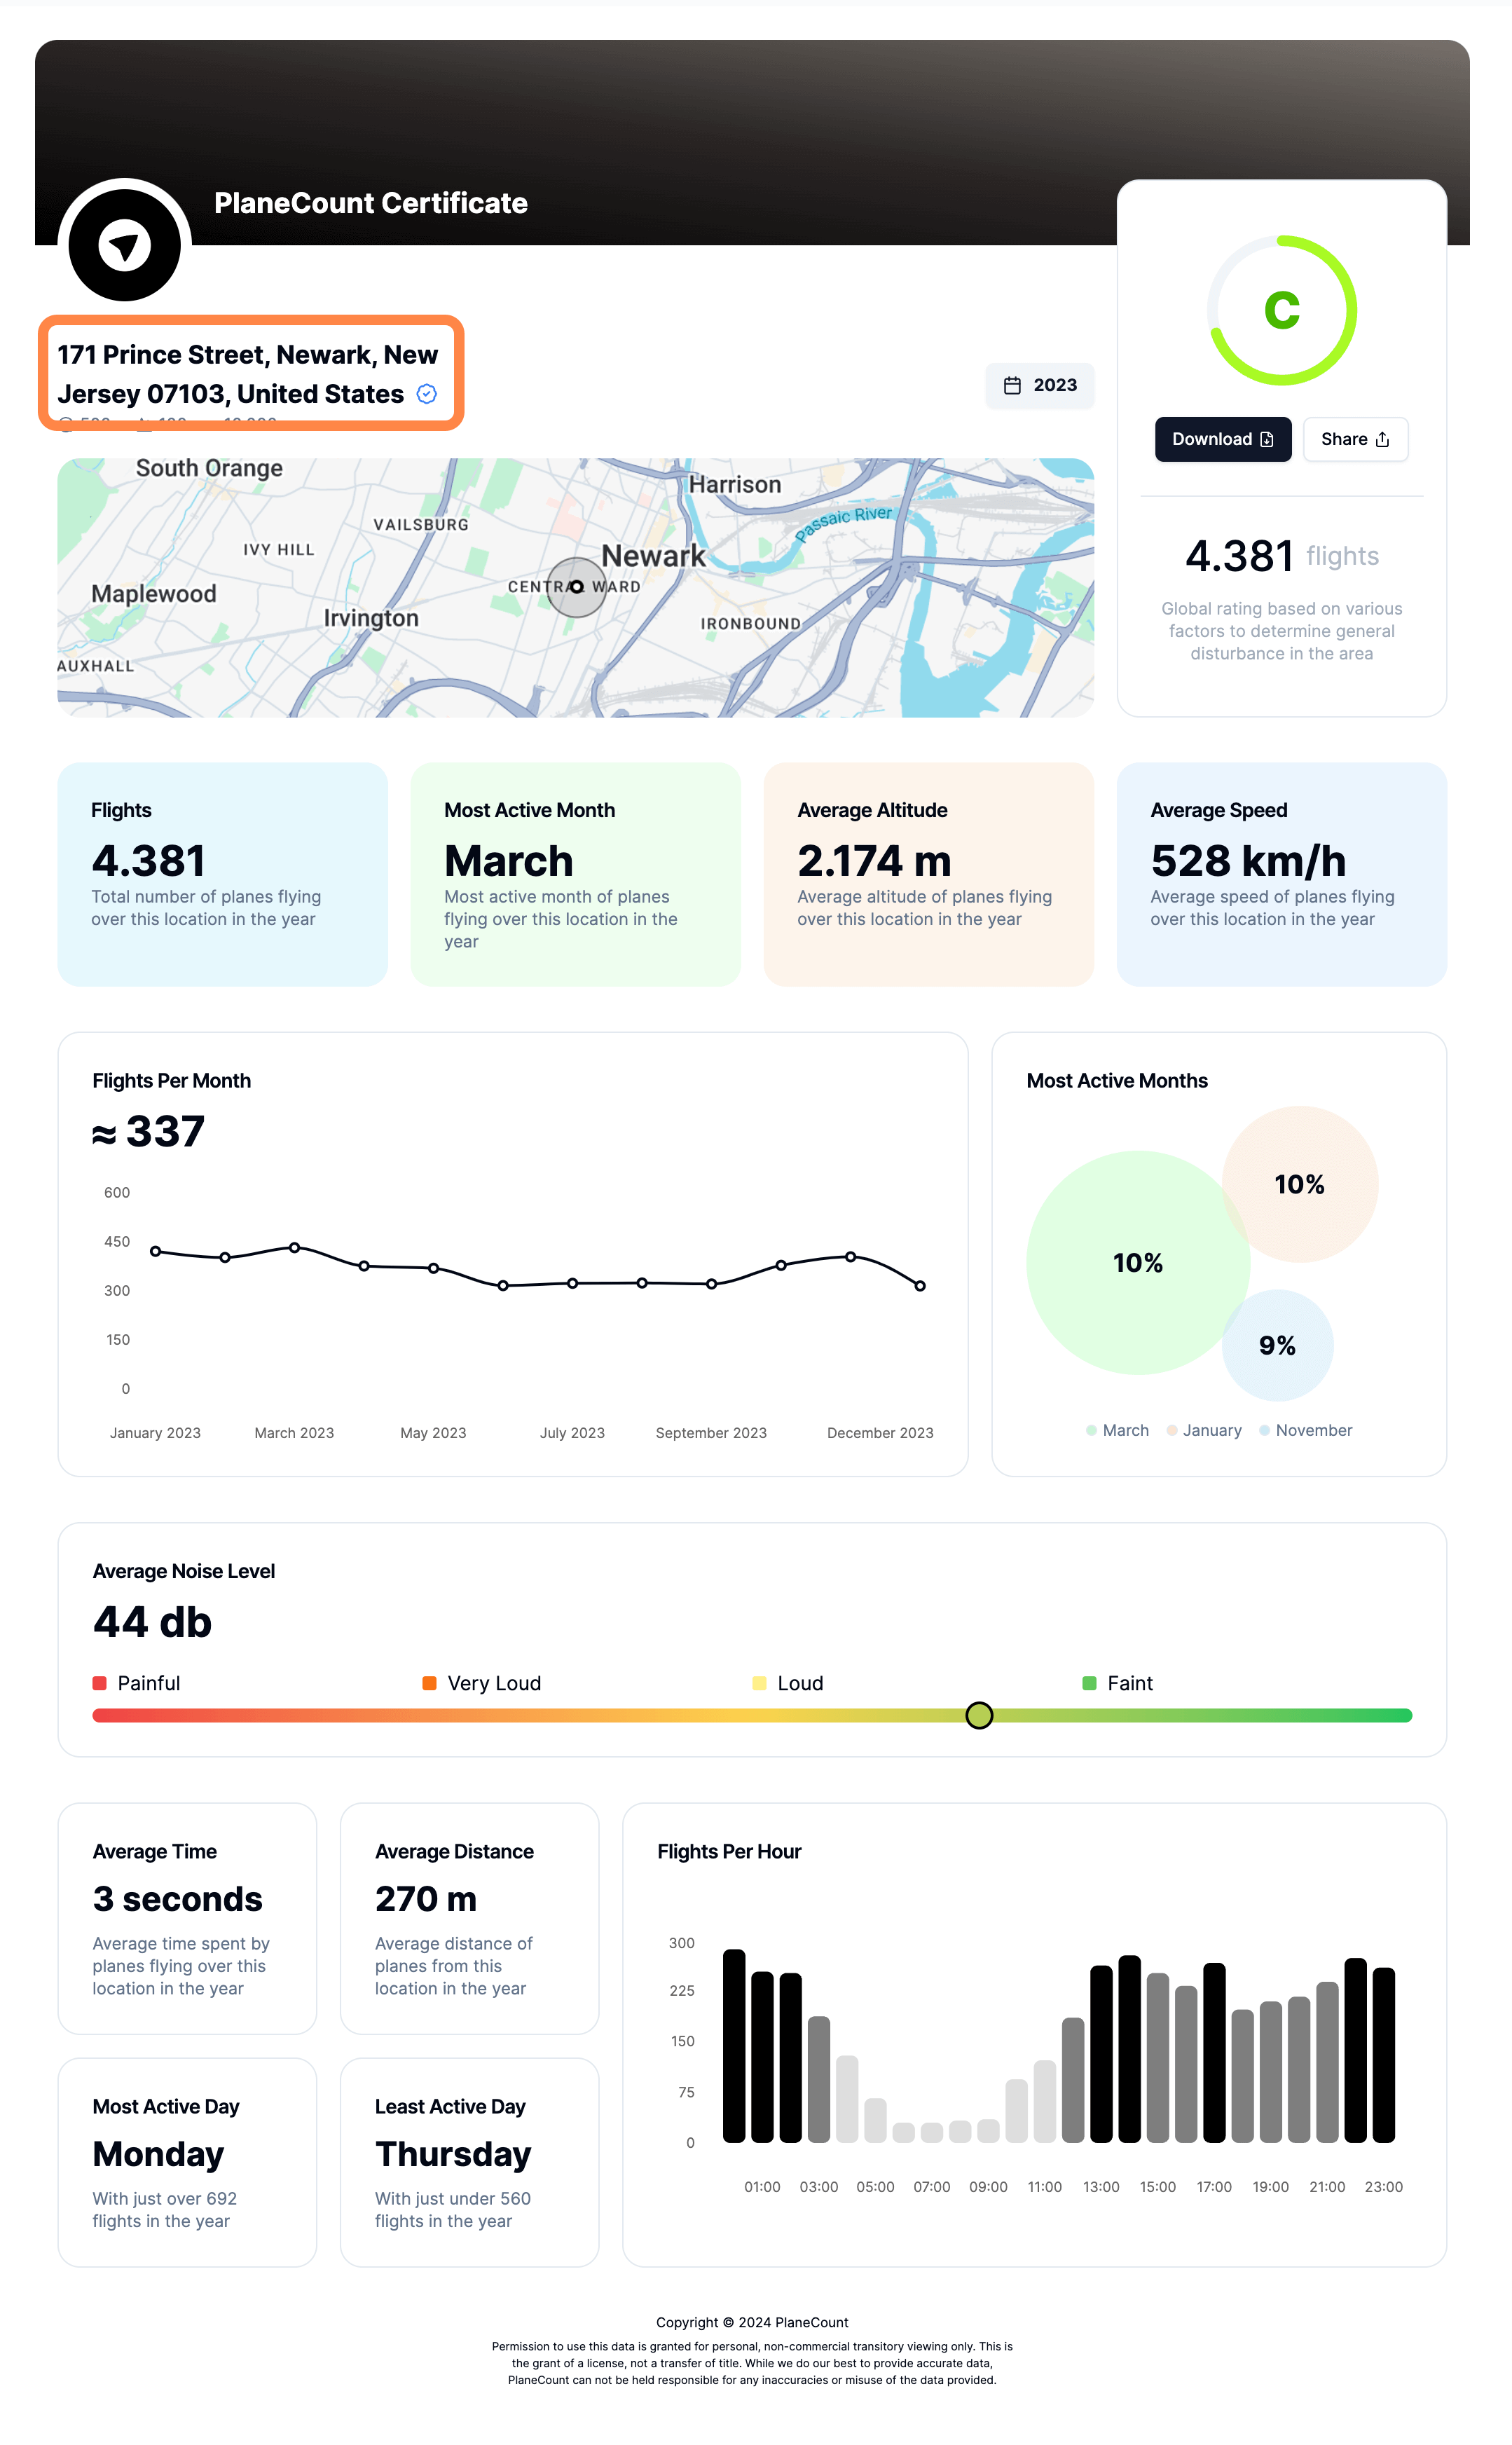
• Address
The exact location chosen for the report will appear as follows:
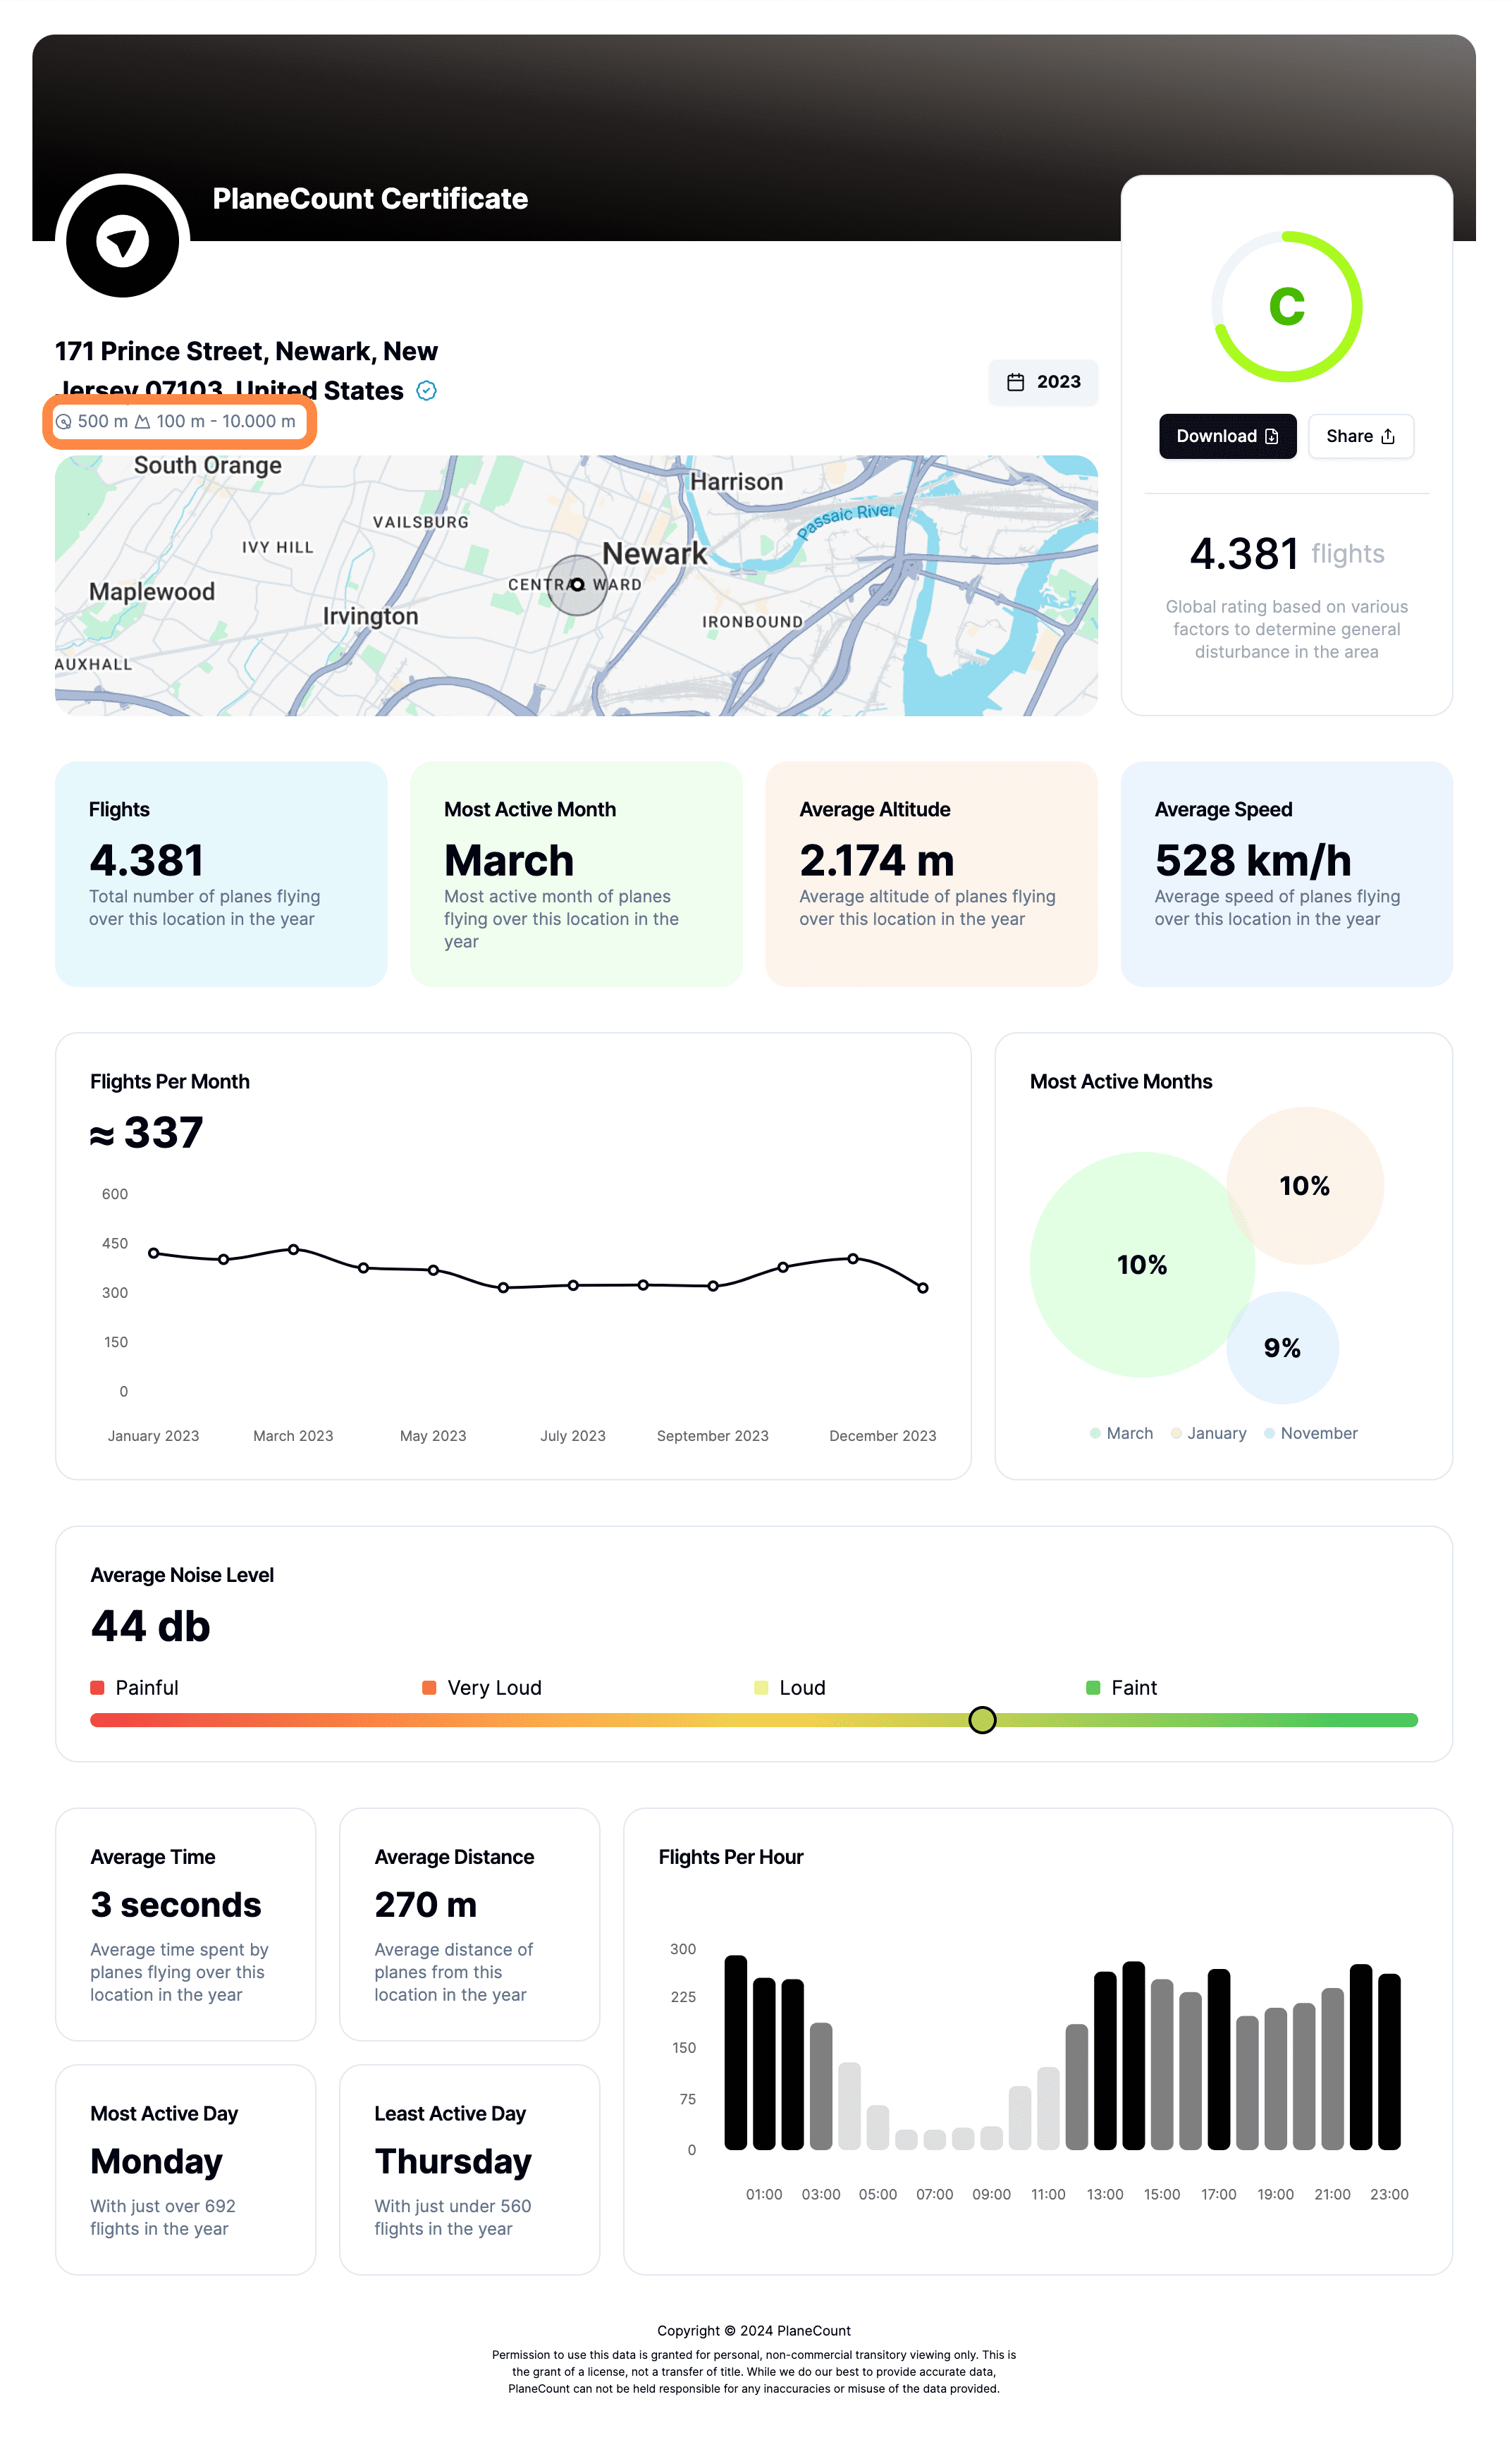
• Tracking distance and altitude
The tracking distance and altitude you have chosen for the report will appear as follows:
• Selected year
The selected year you have chosen for the report will appear as follows:
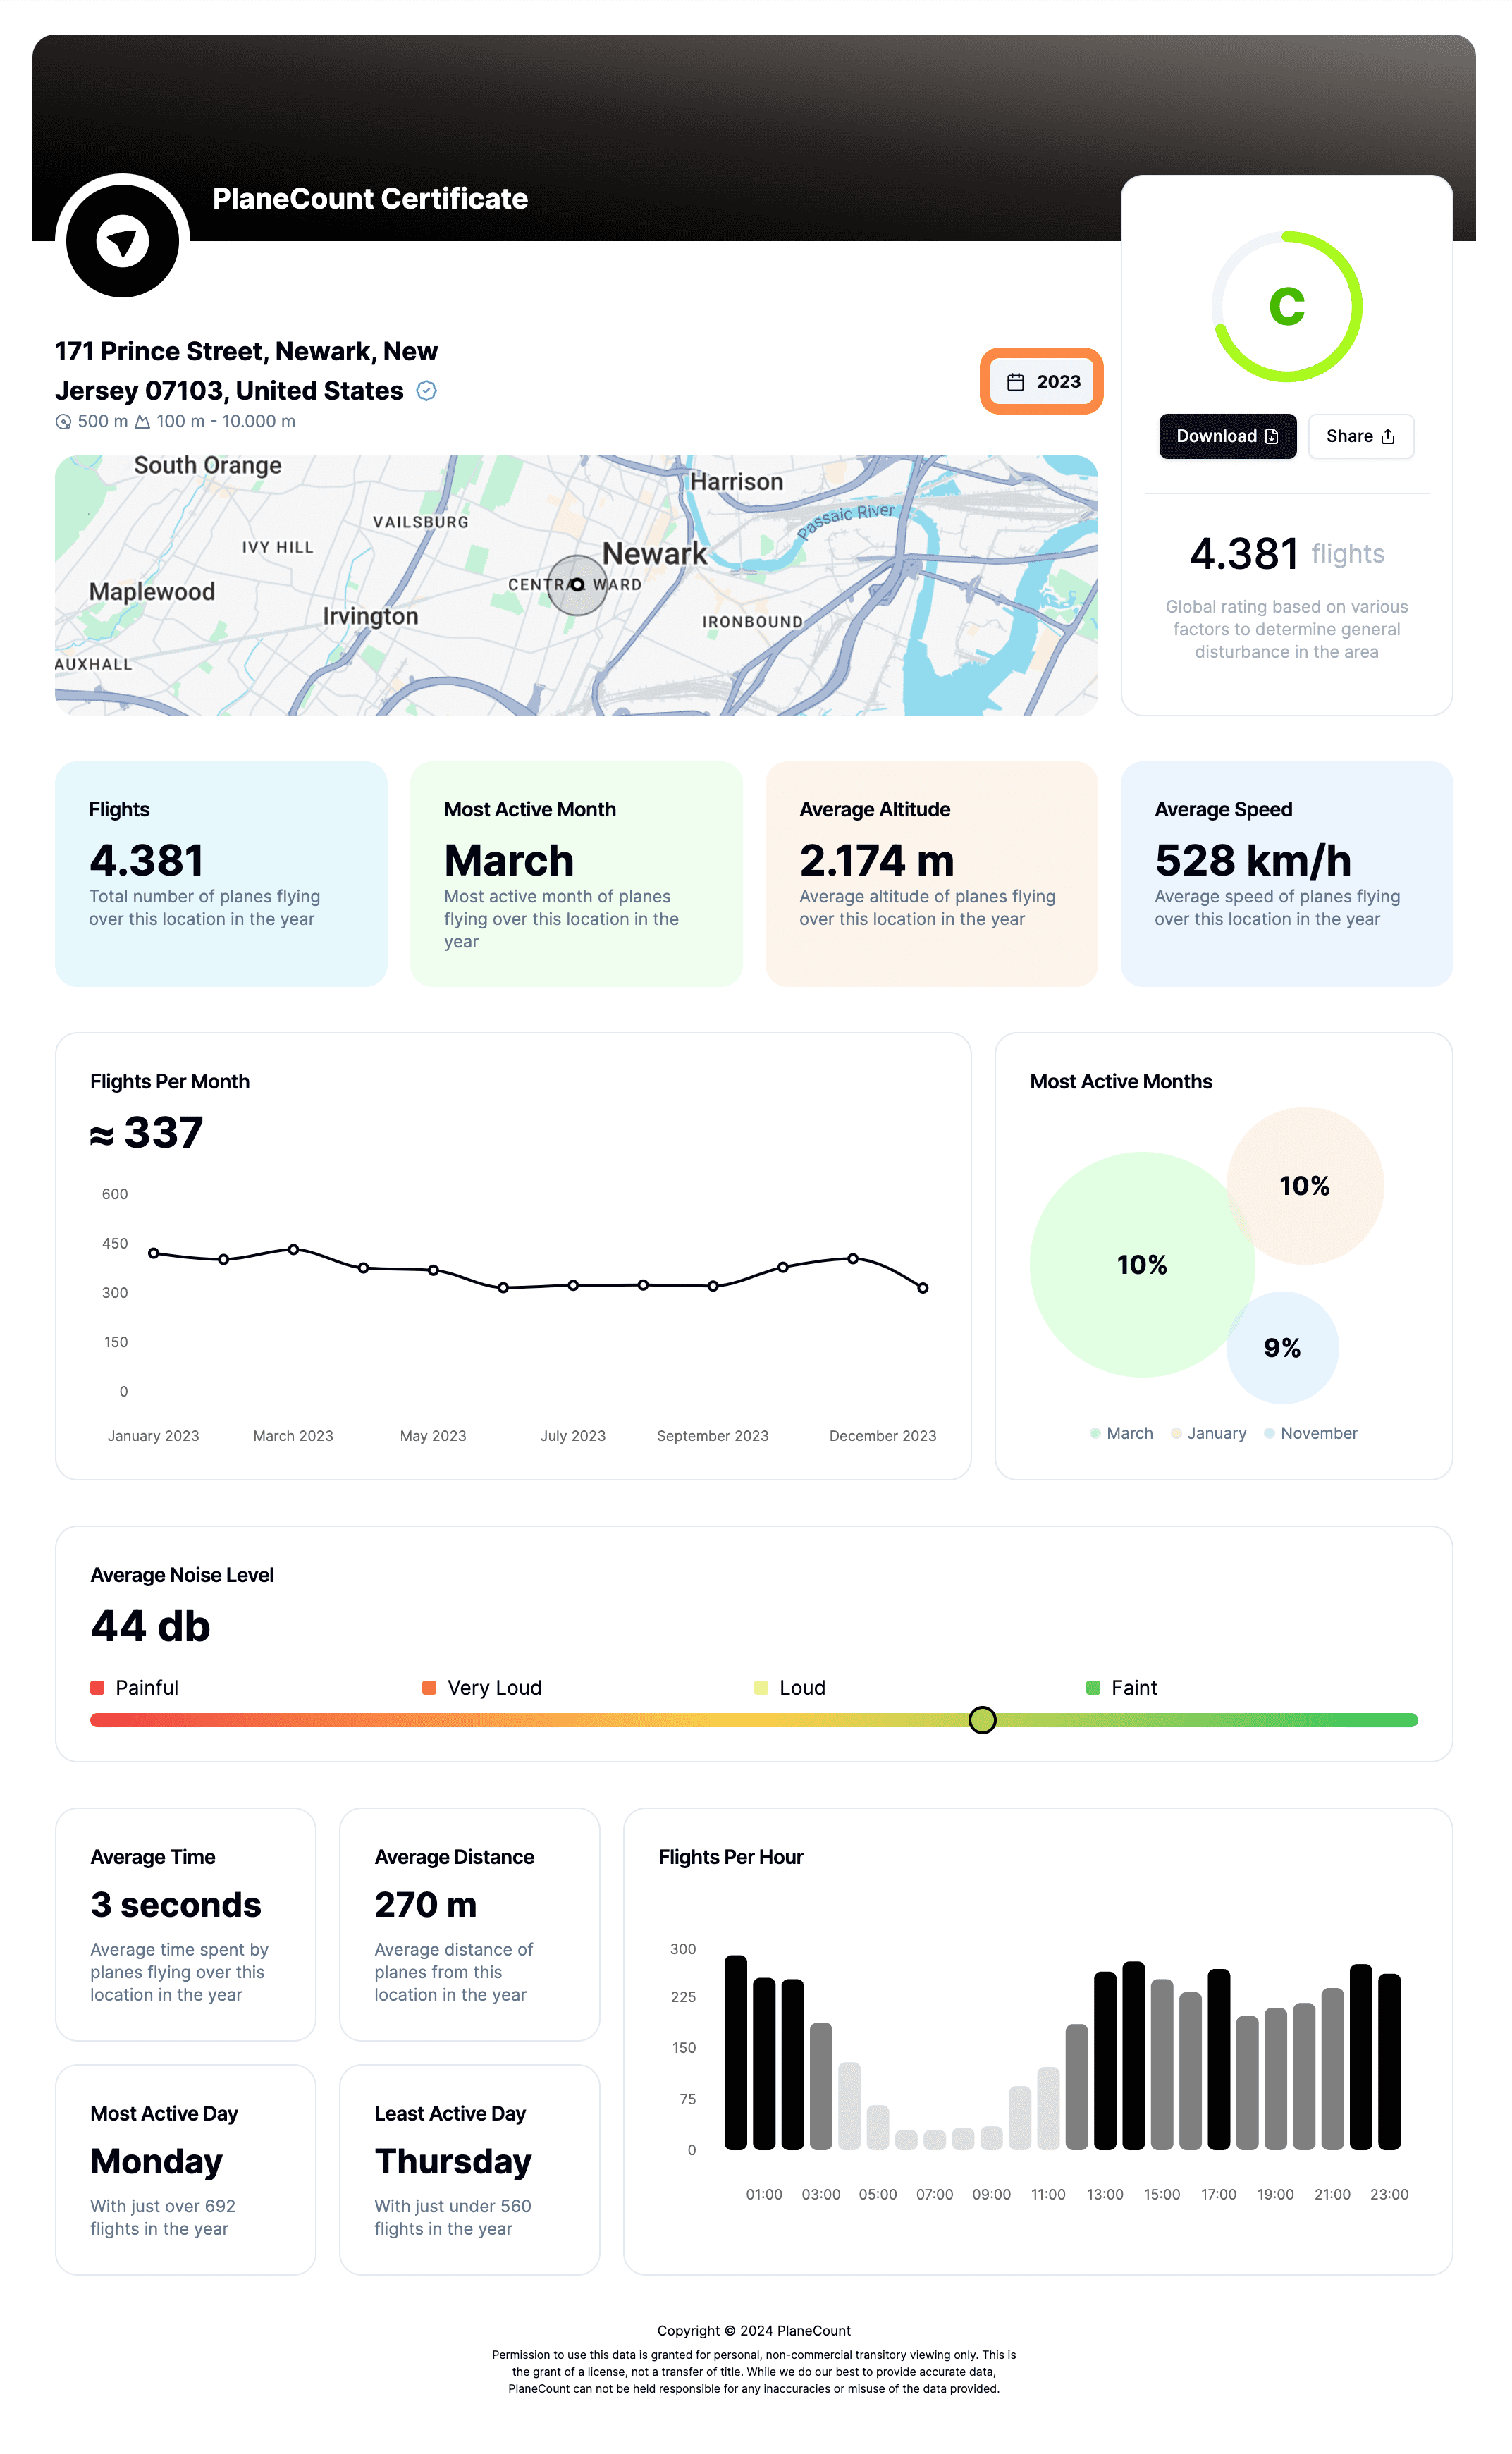
To gain more insight into a location's flight history, you can obtain a report for a different year. Simply click on the date field and select the desired year.
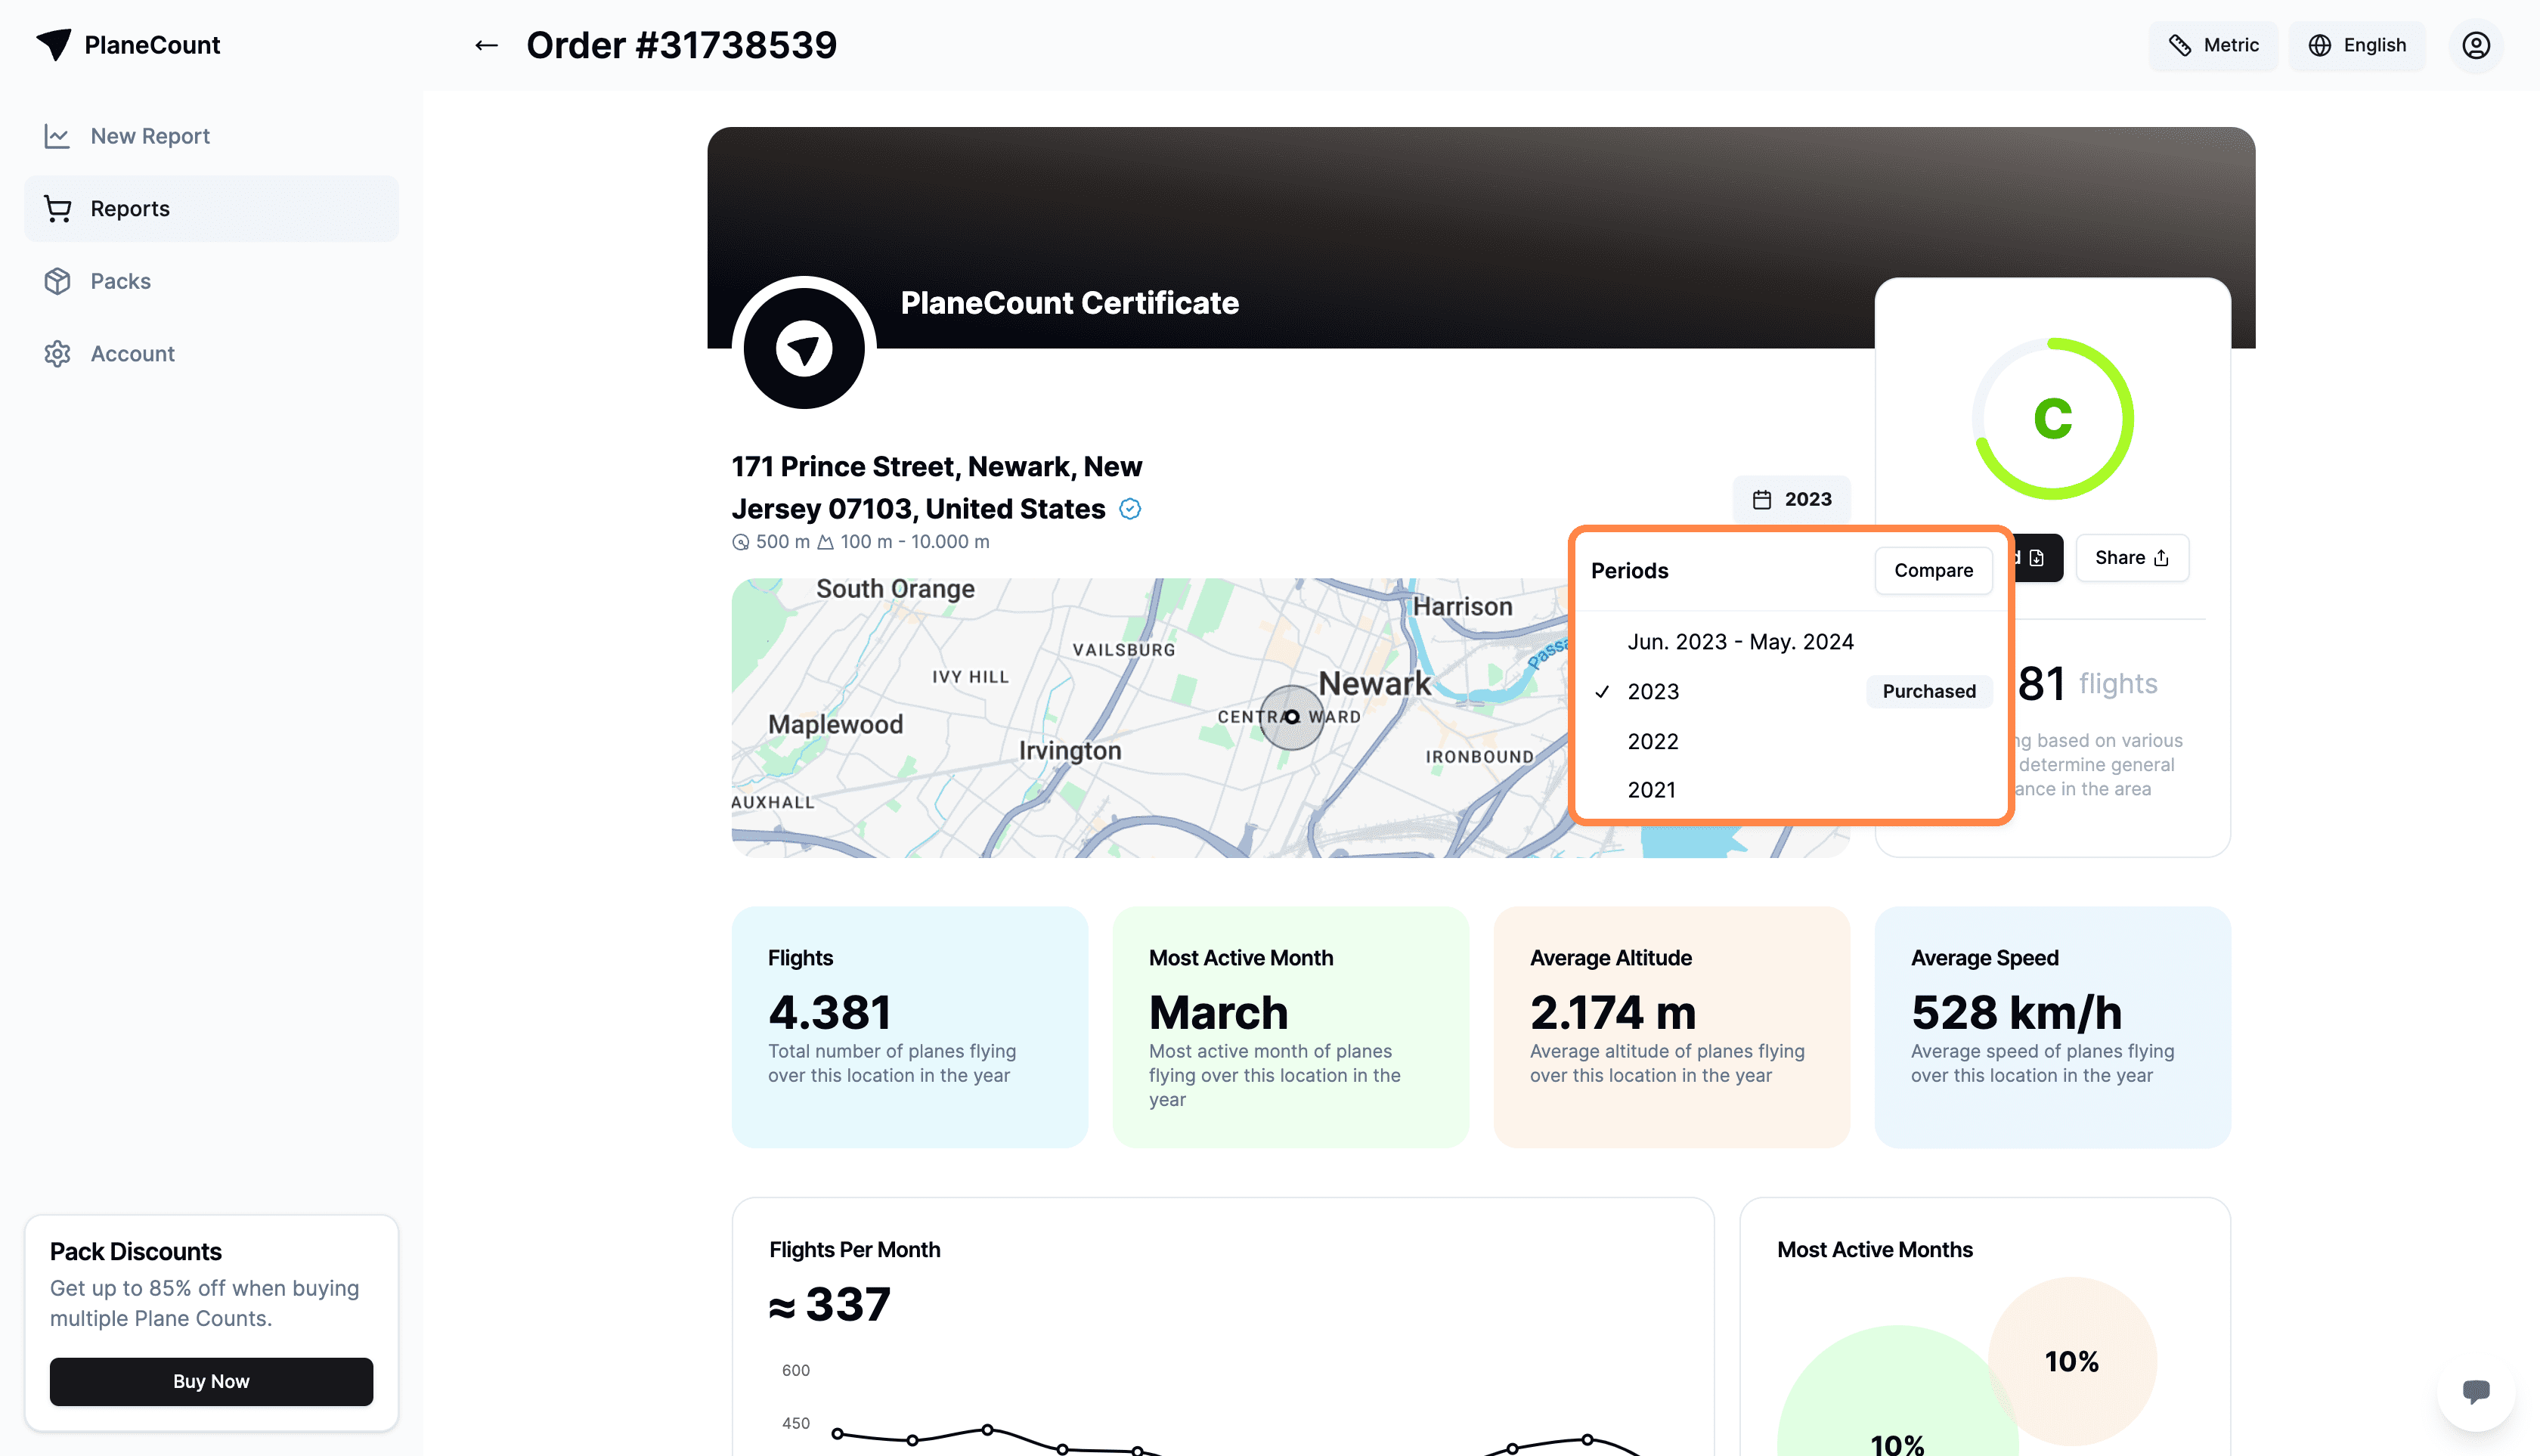
Please note!
A separate purchase is required to obtain a report for the same location for a different year.
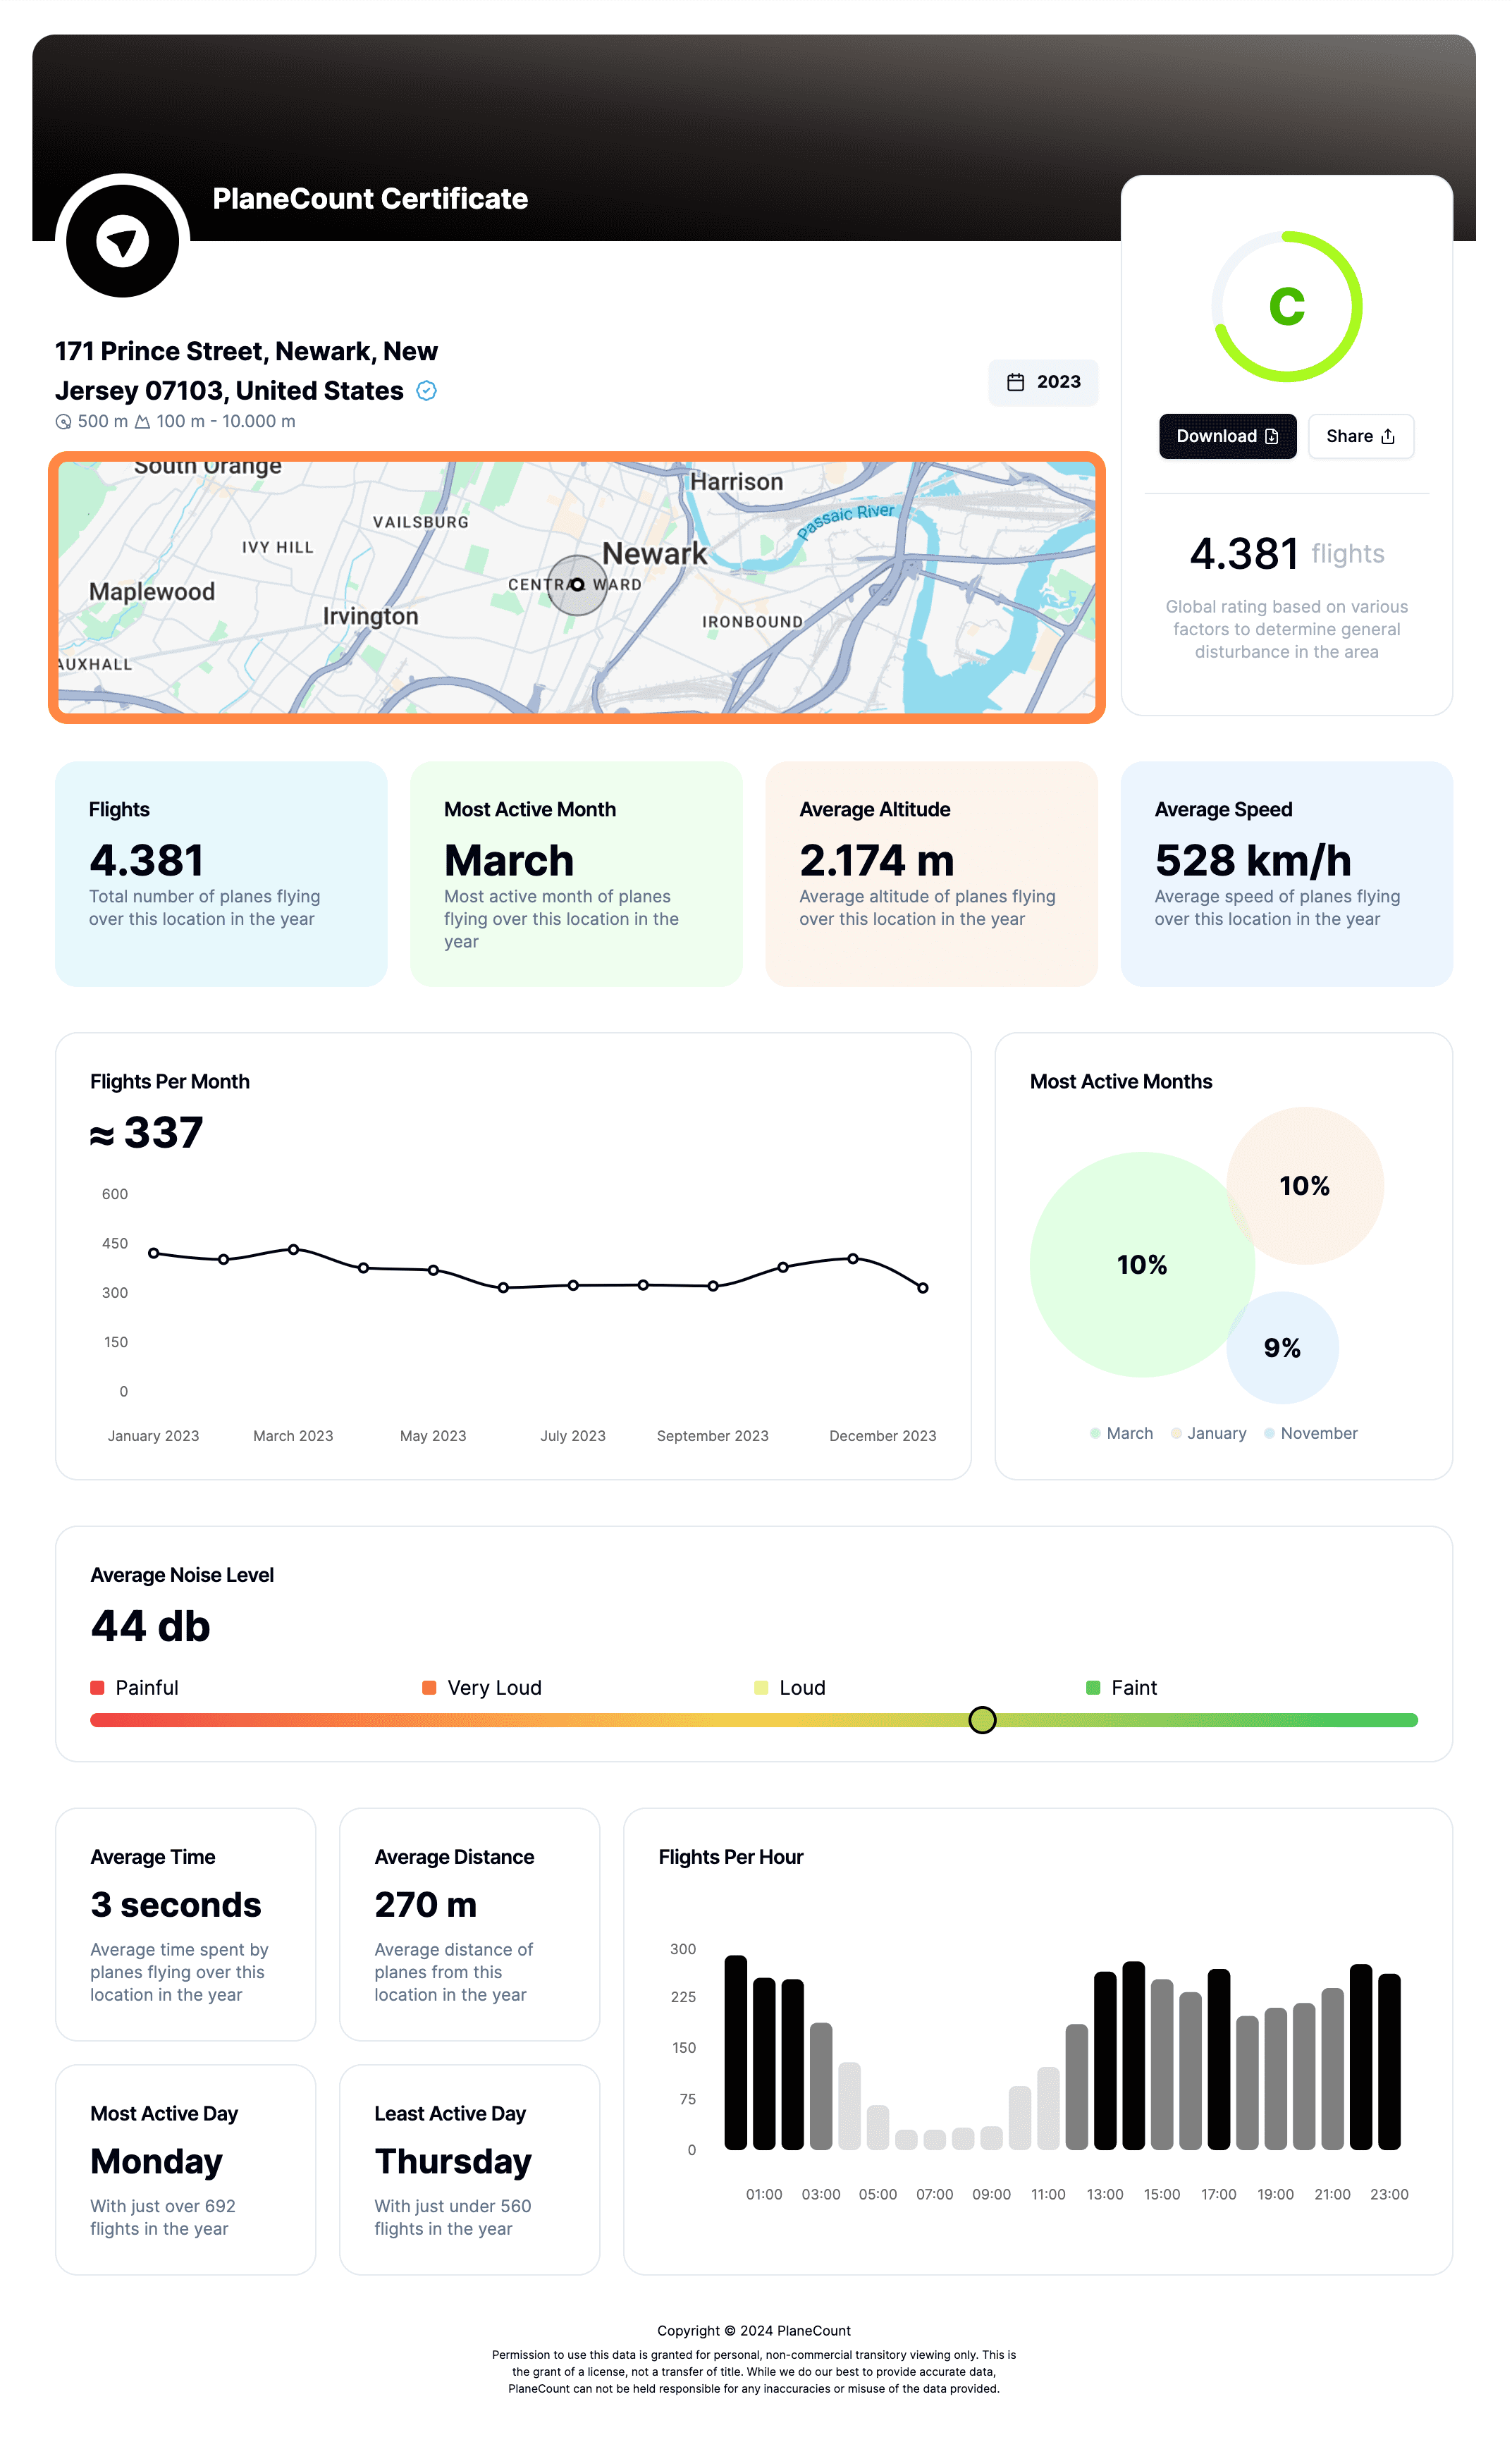
• Map
The report includes a visual guide with an overview of the chosen location's map, displayed as follows:
Rating and share
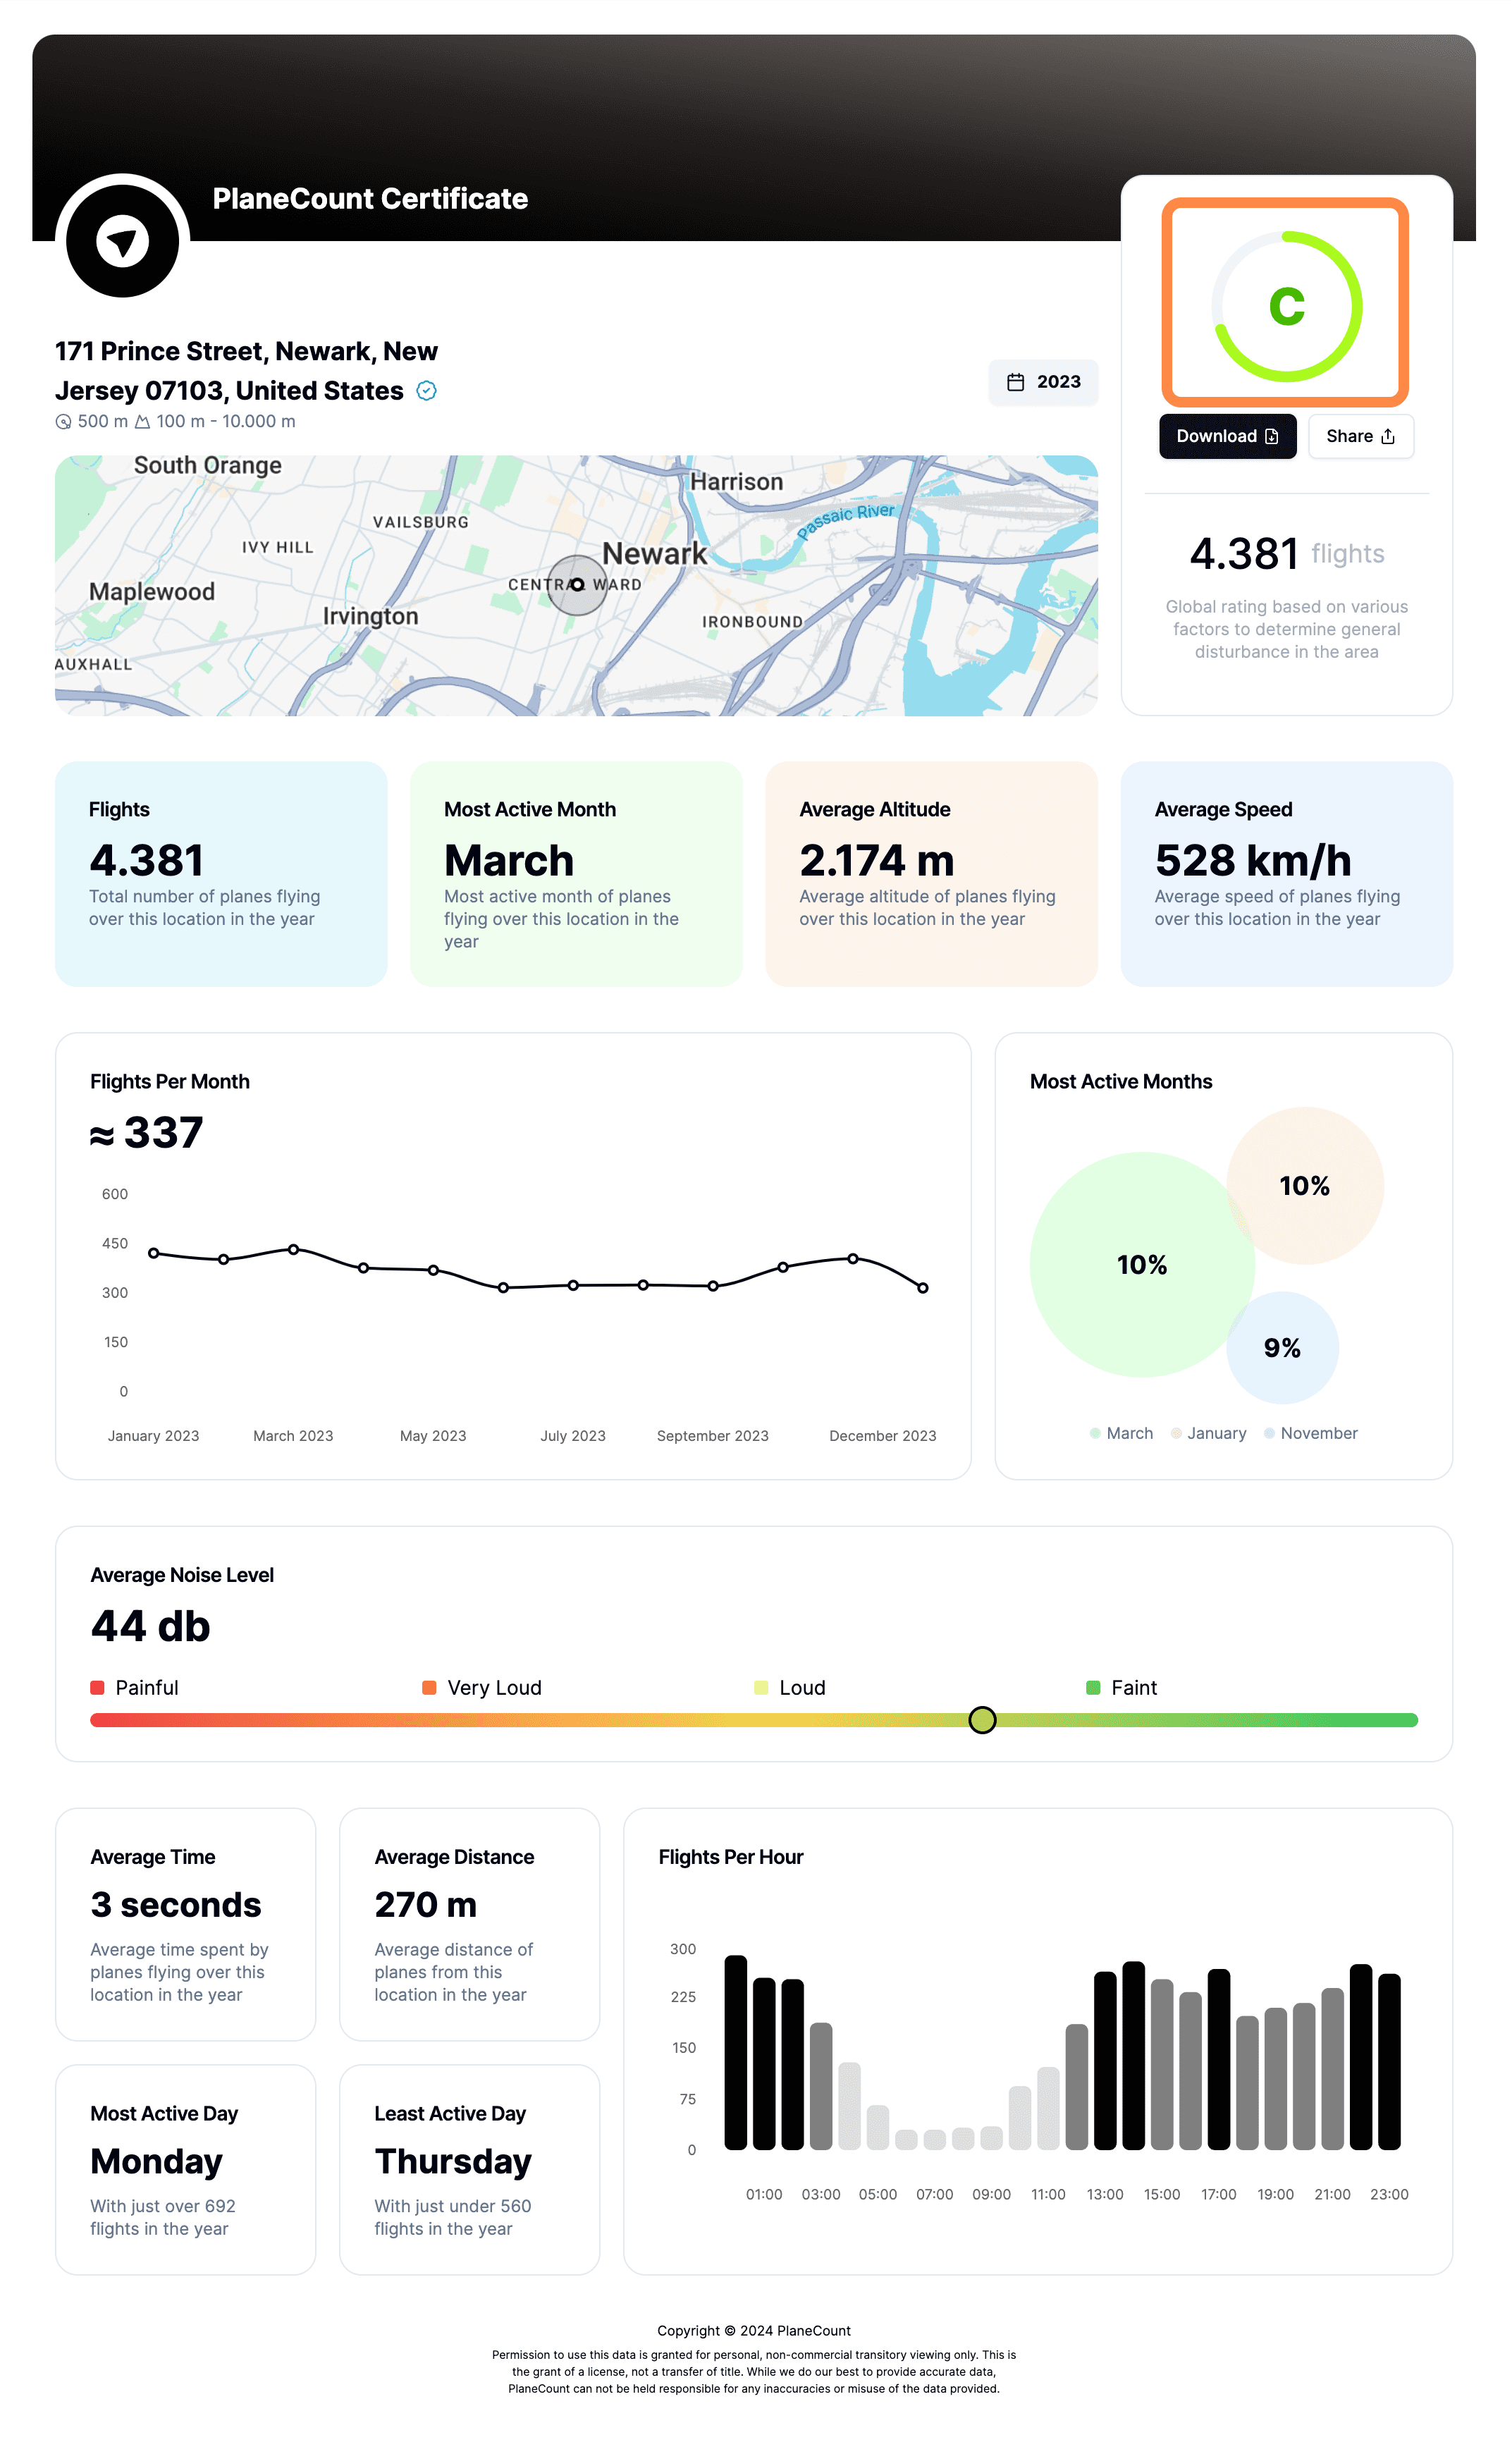
• Rating
Your PlaneCount report comes with its very own rating! PlaneCount certifies your location on a scale of A to G based on how much of a nuisance planes are in your selected area.
Find your rating here:
Please note!
To ensure consistent ratings, the PlaneCount certification applies to 1000 meters. If another distance is selected, the report is not certified.
• Download & share
To download your report, click the Download button.
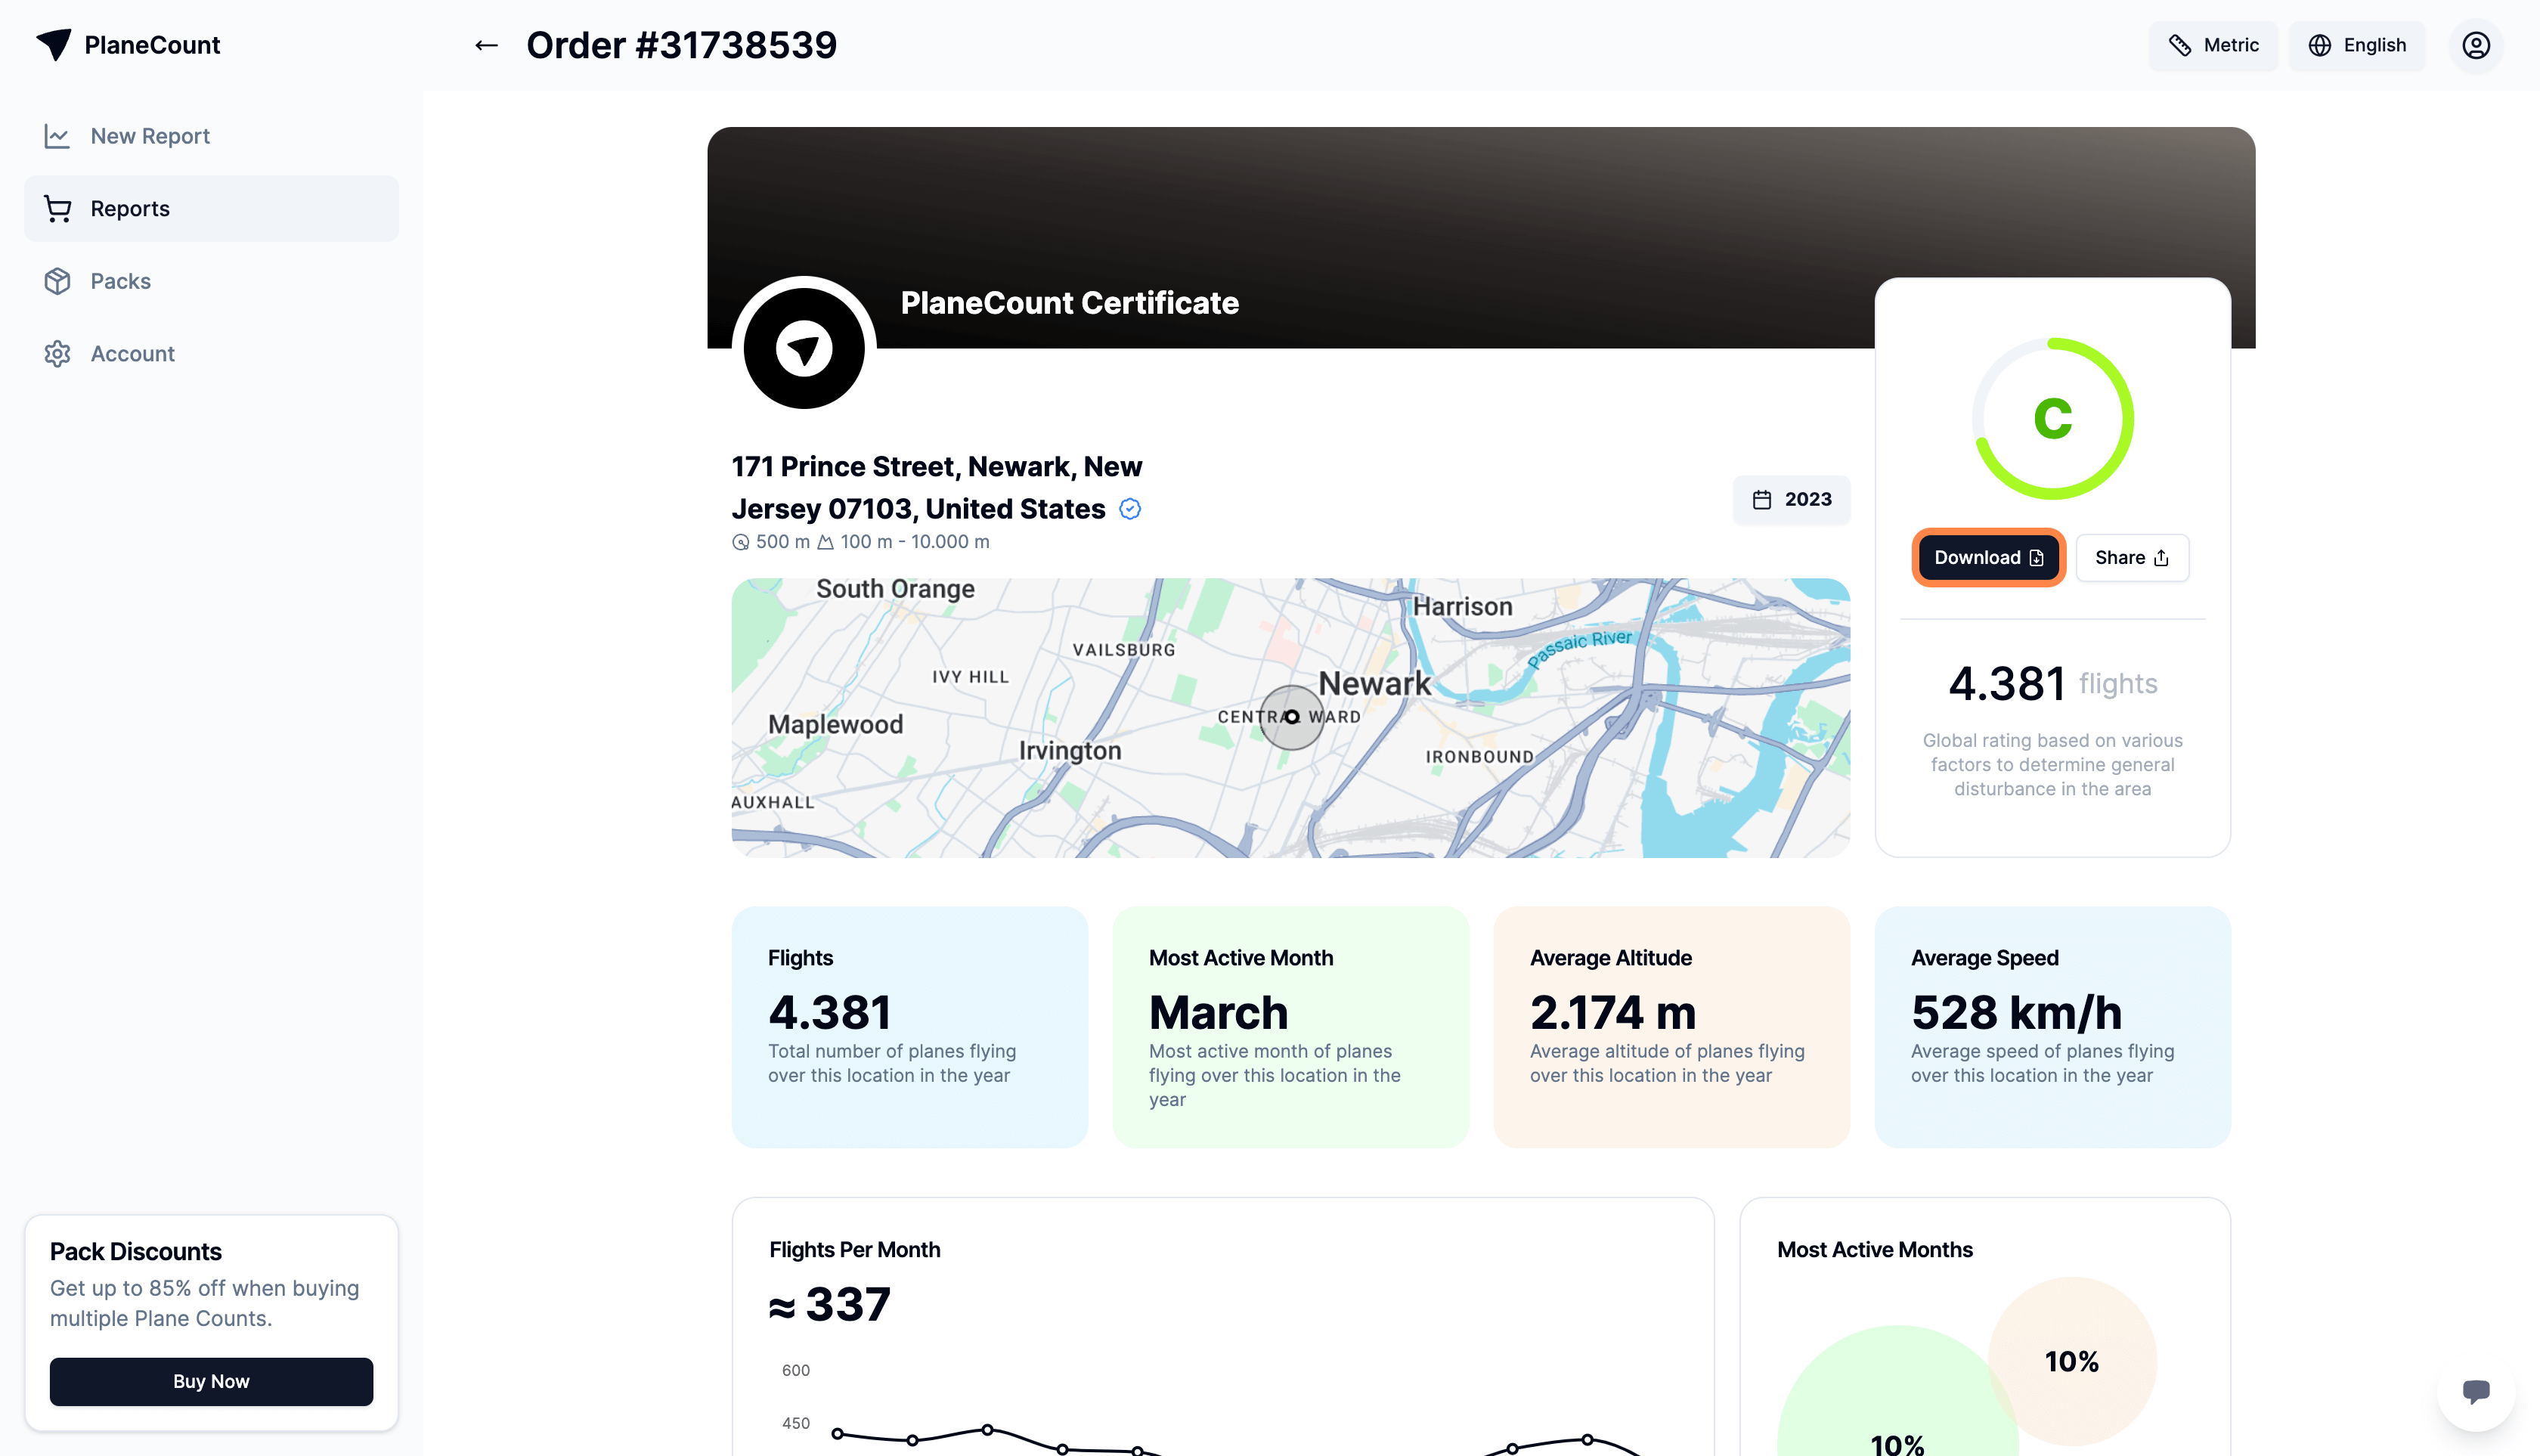
To share your report, click the Share button, and choose:
- Or simply copy the link.
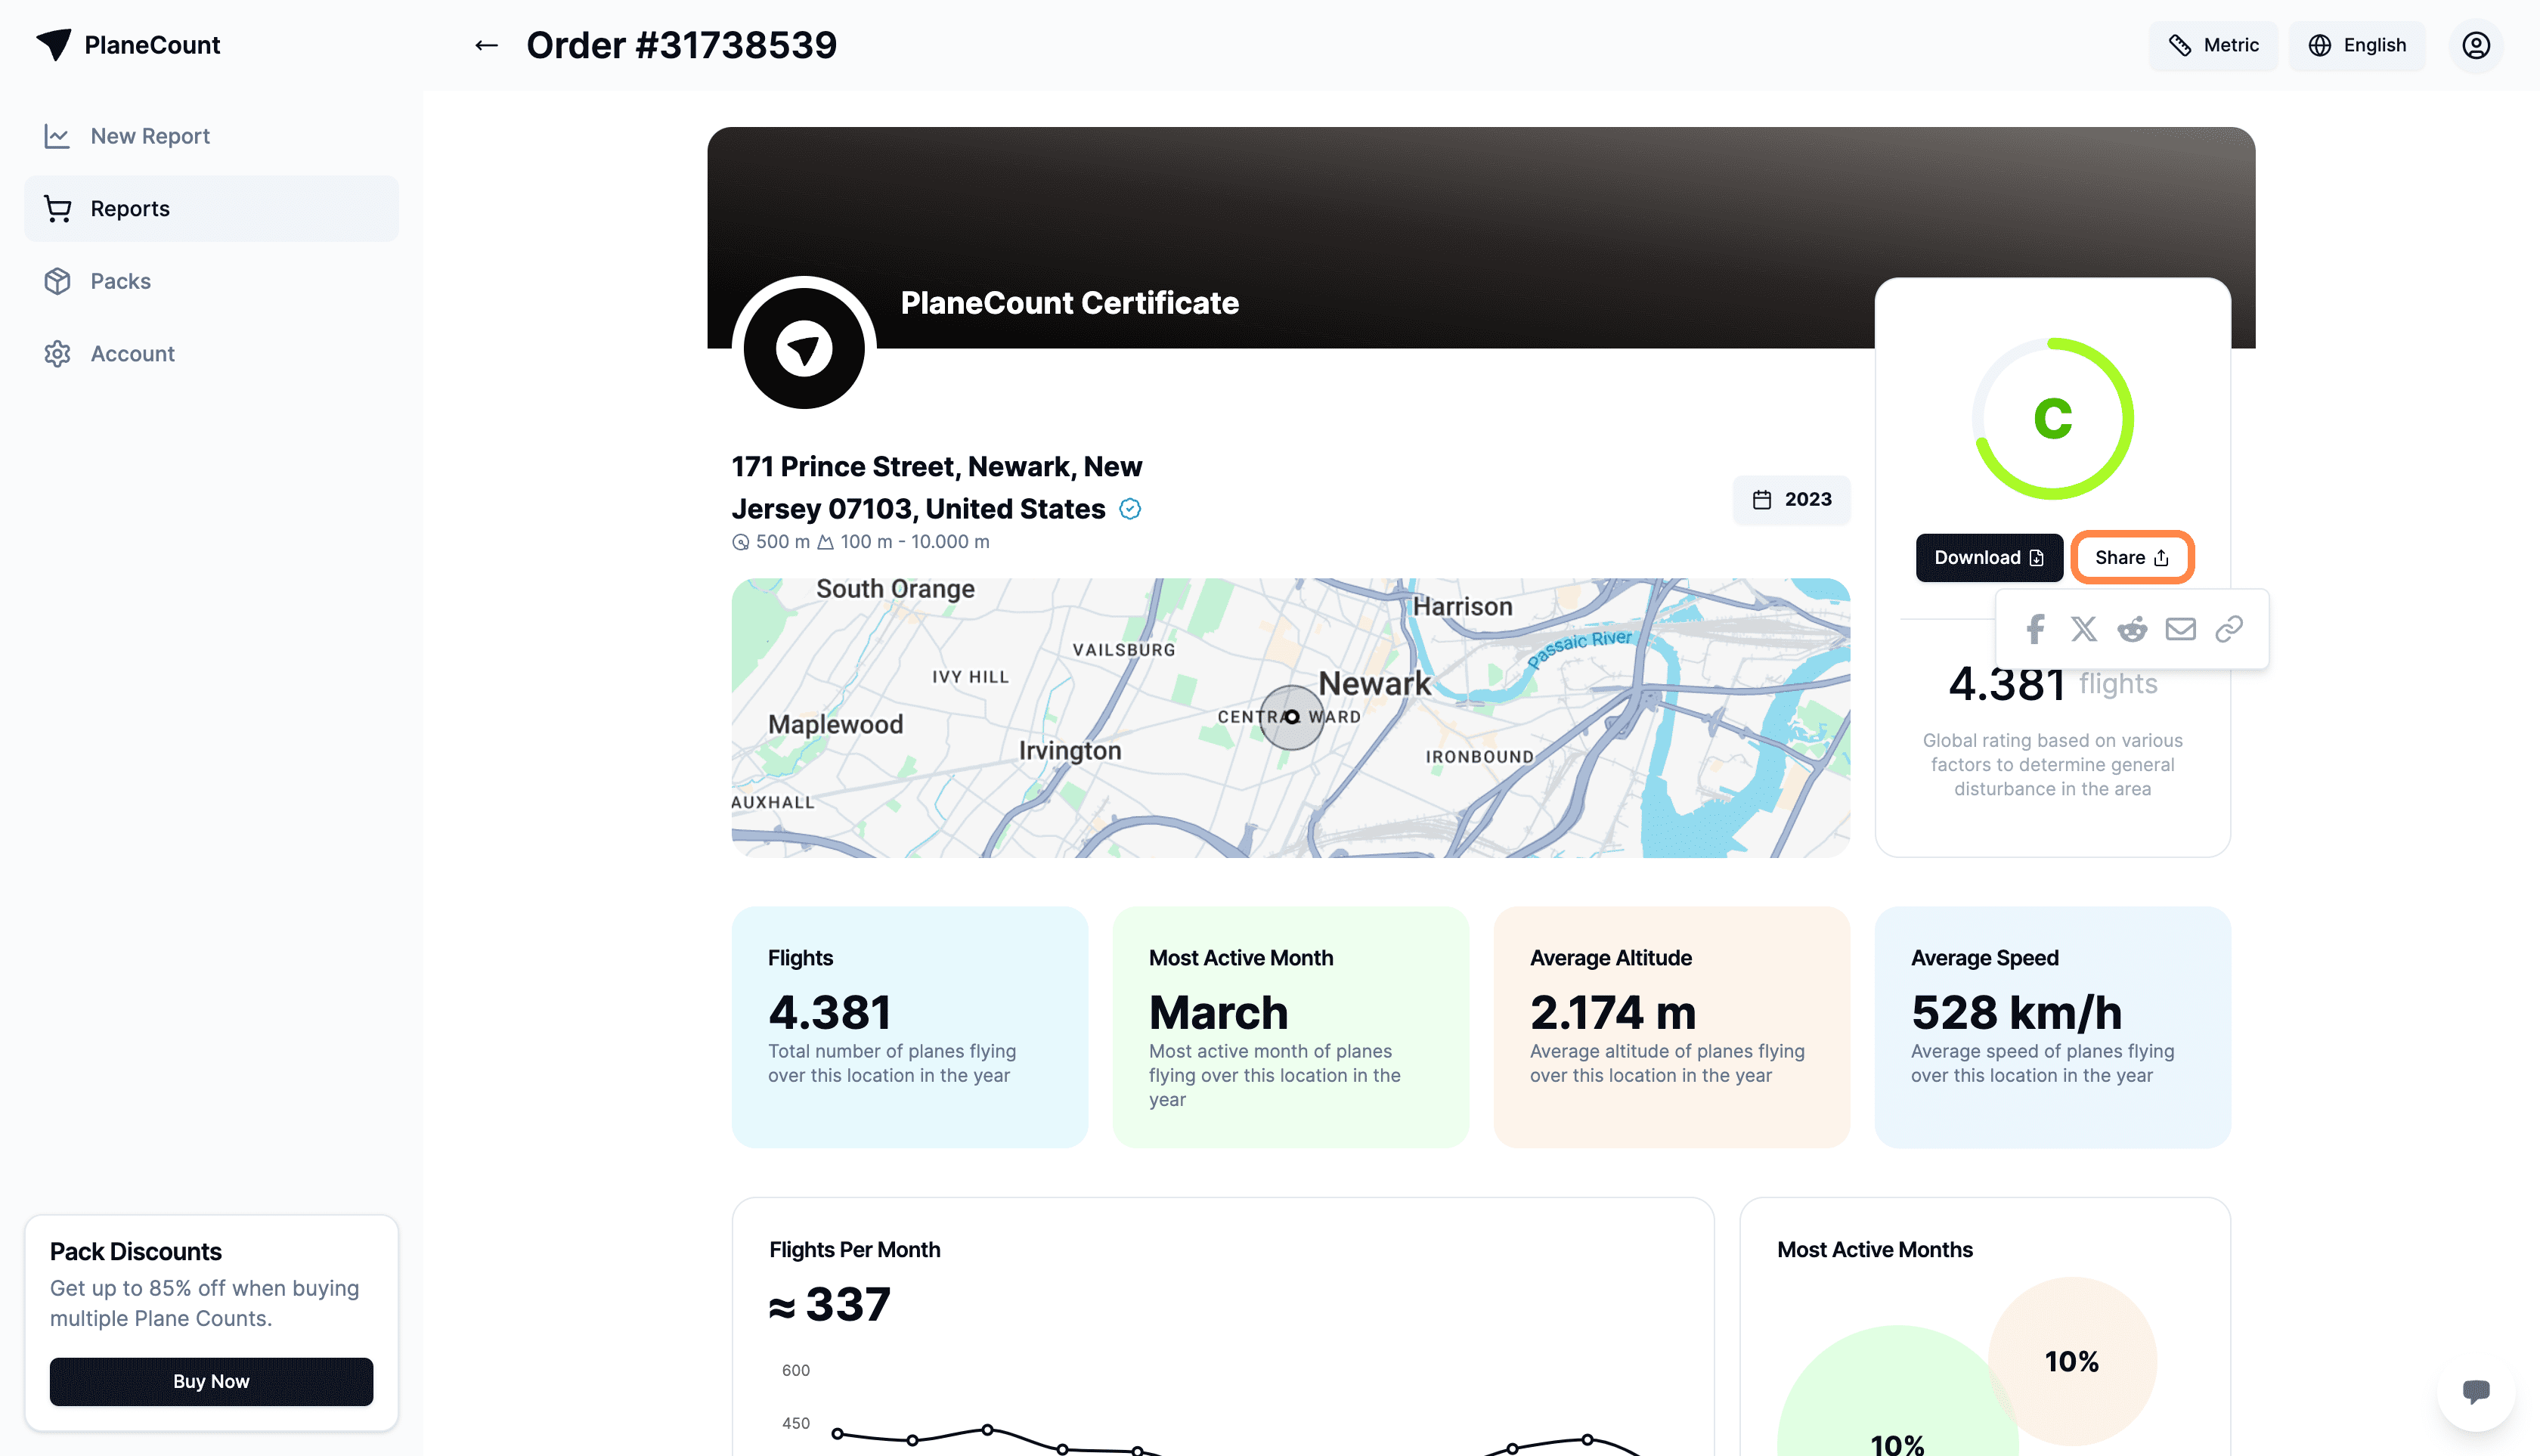
• Quick stat
At a glance, discover the chosen location's number of flights per year.
Flight stats
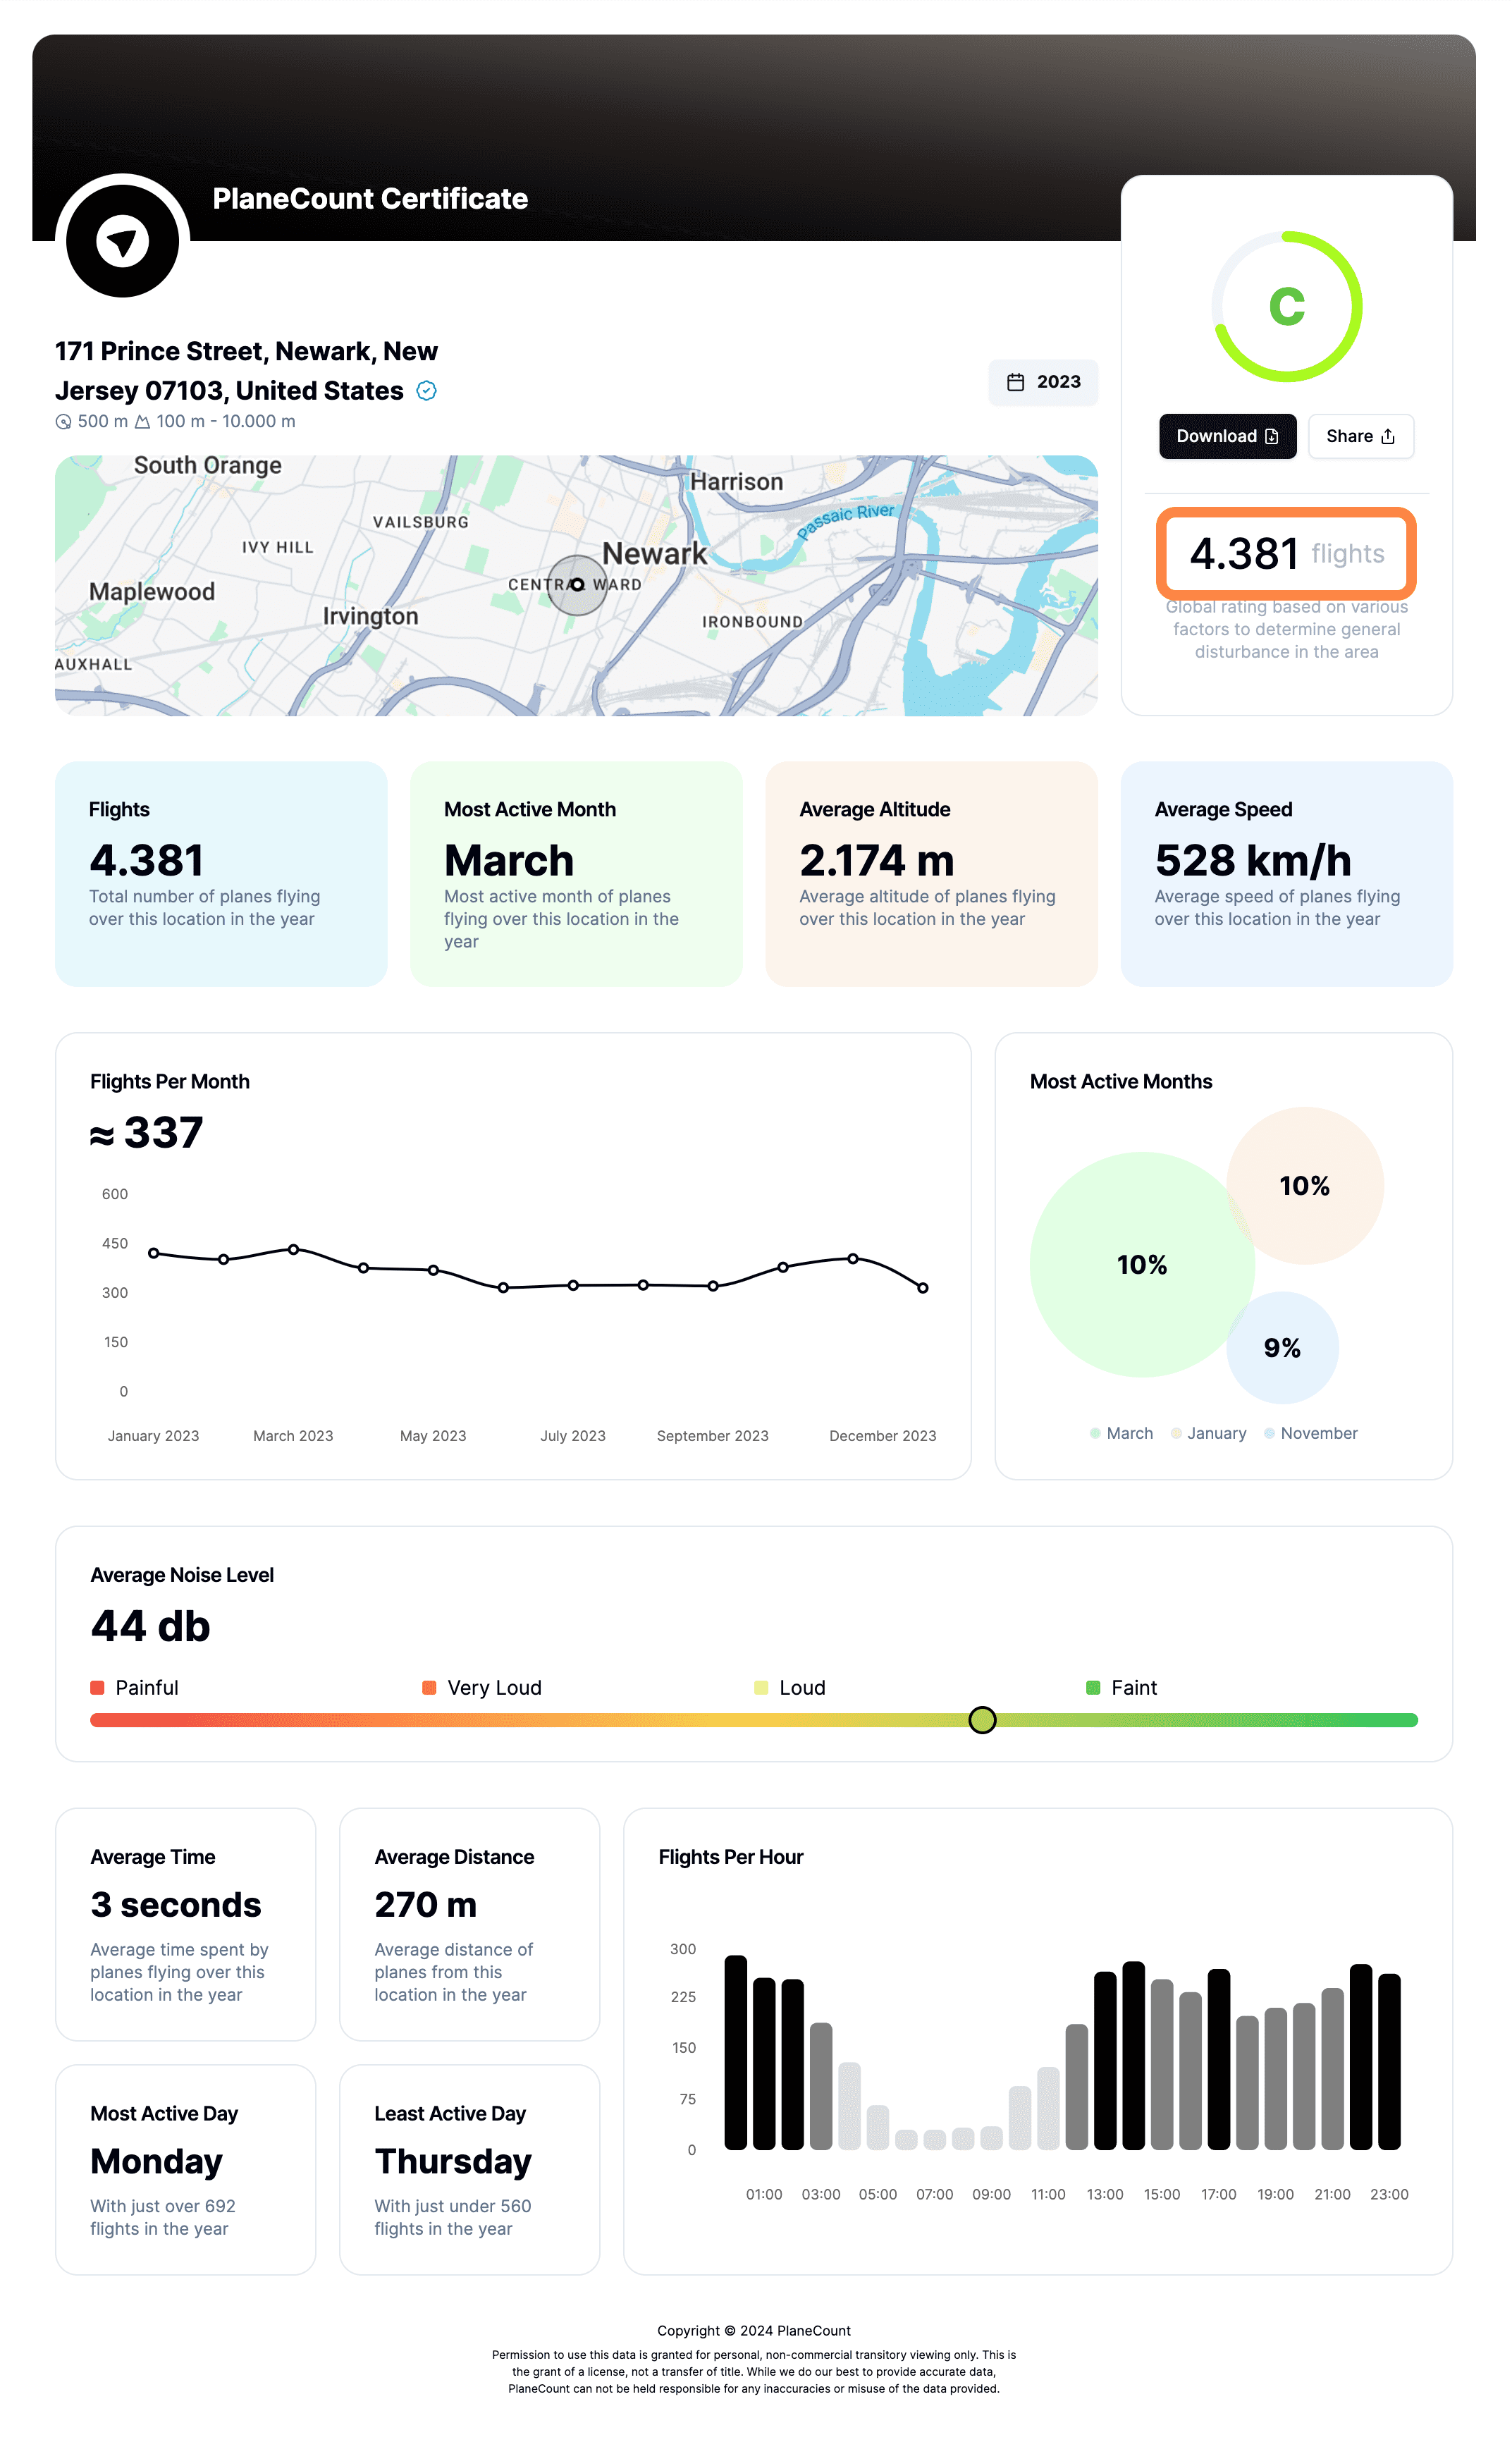
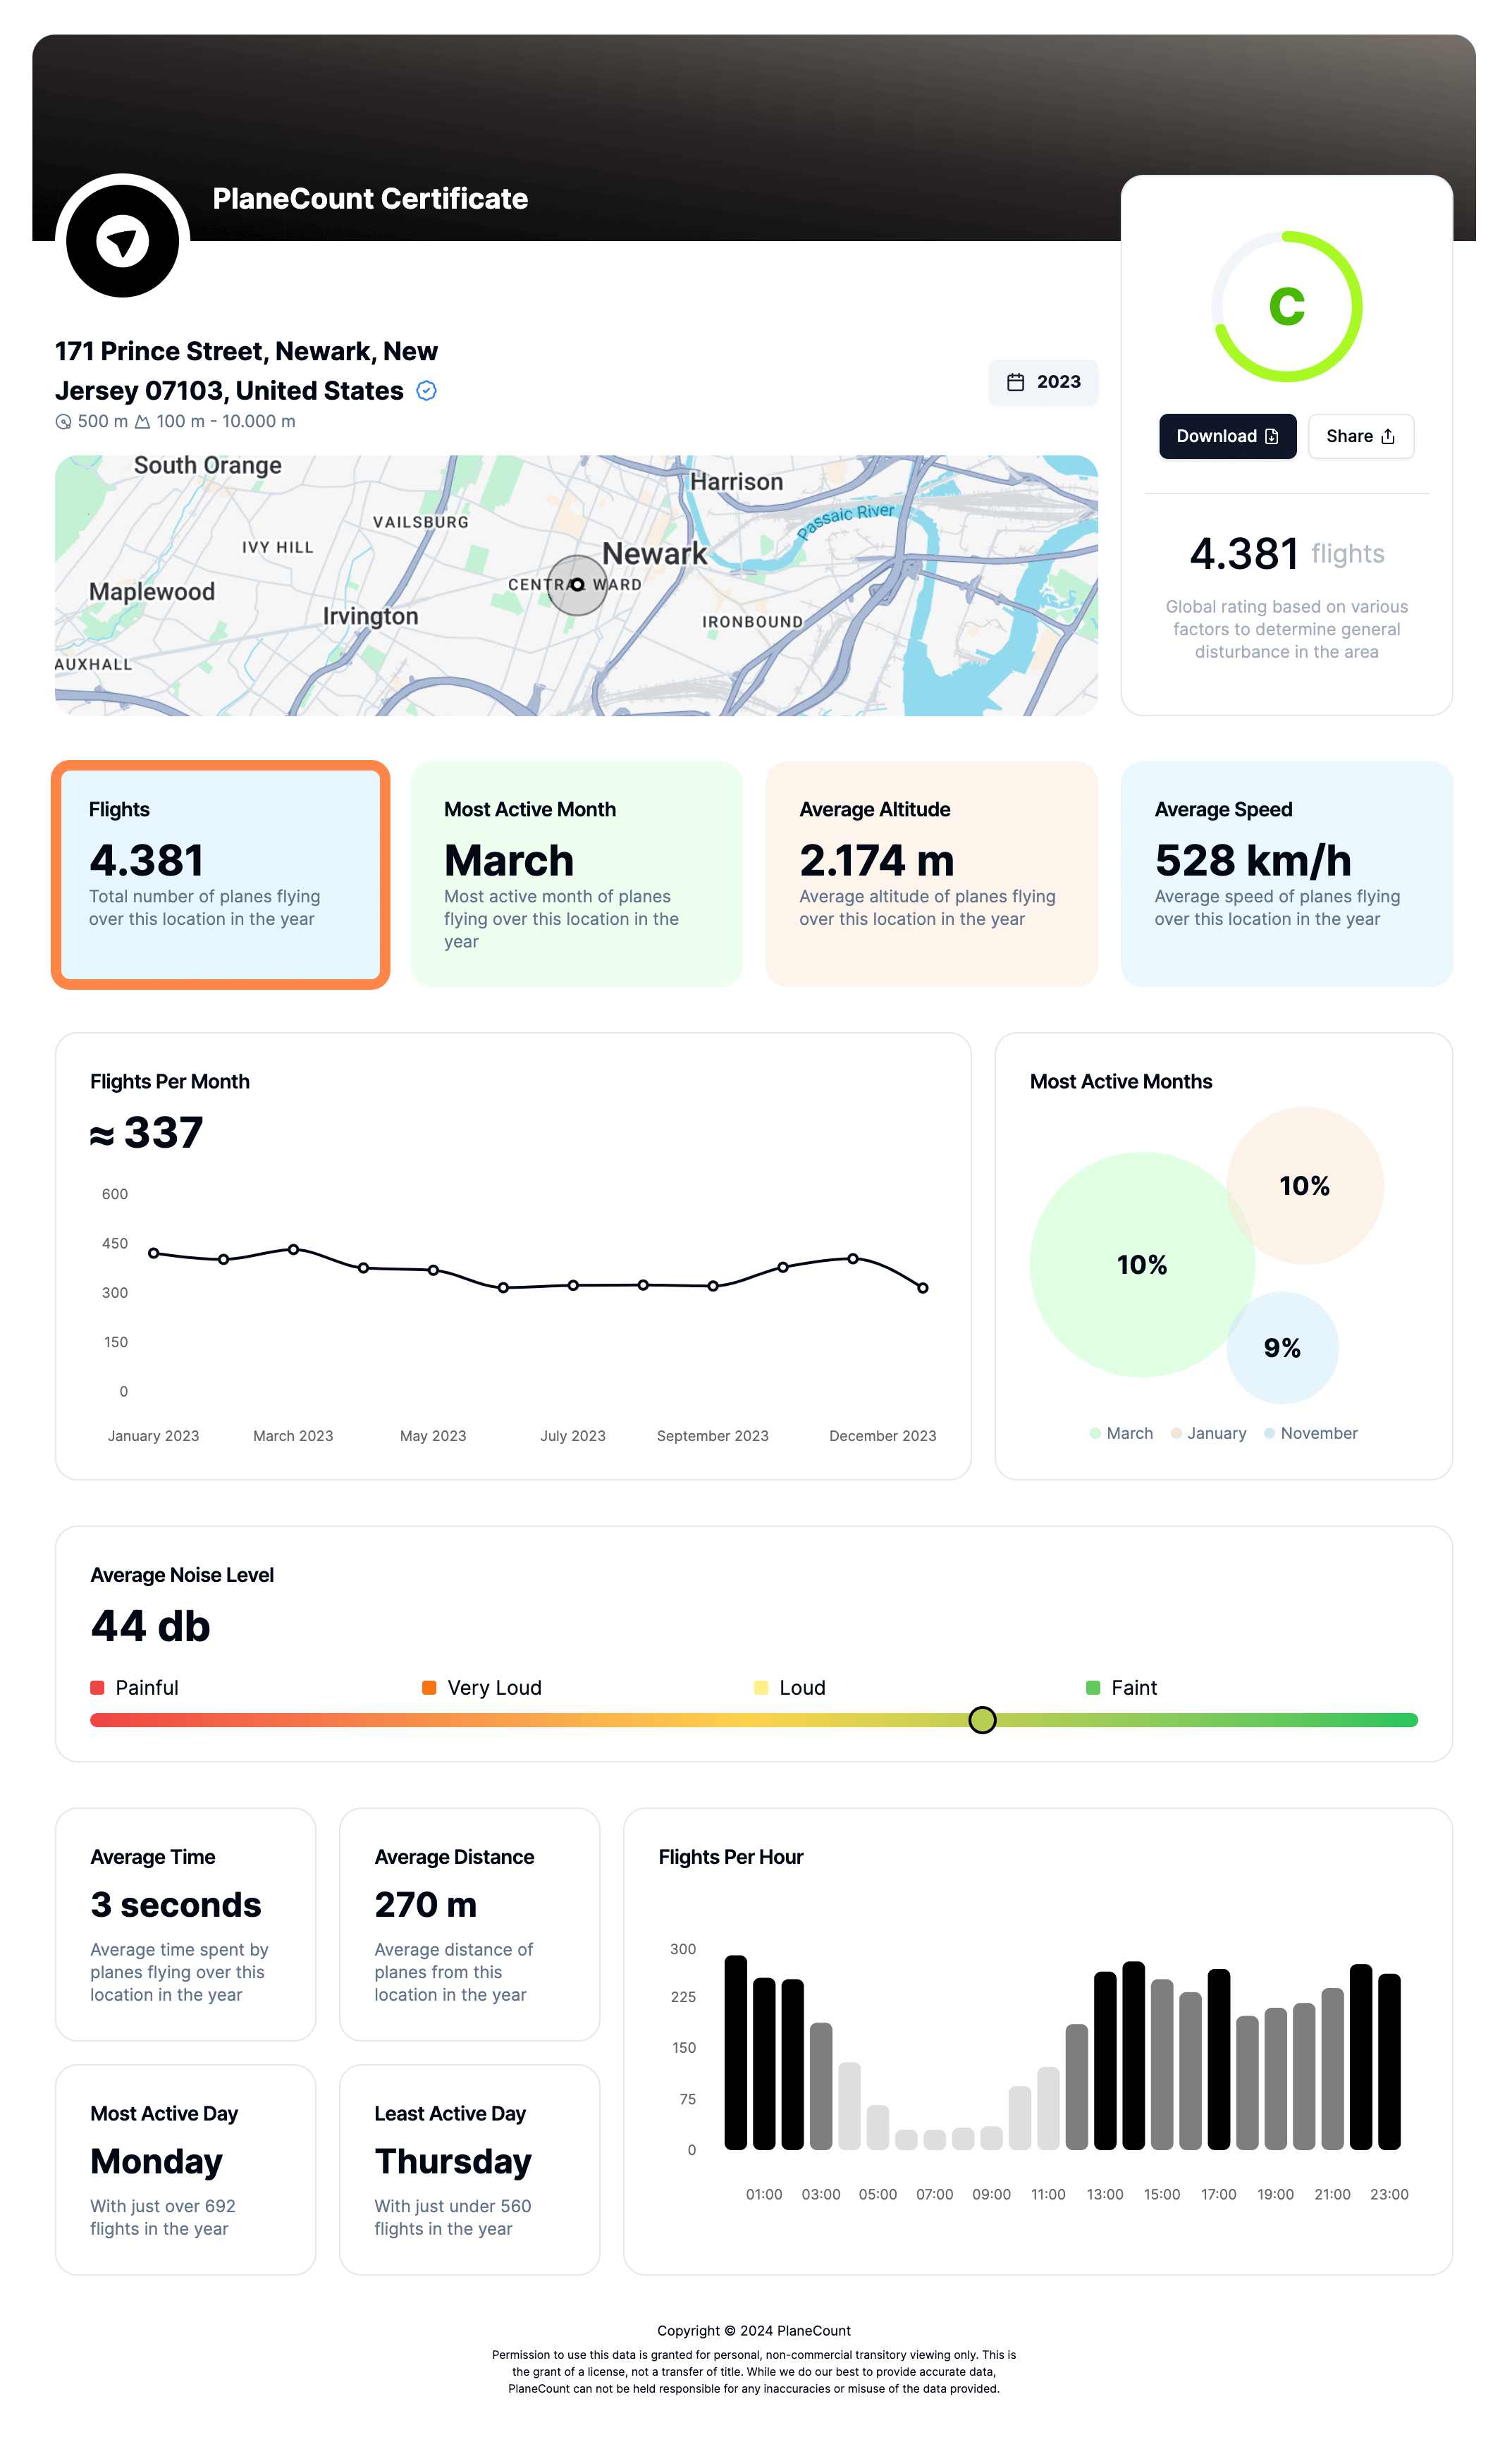
• Flights per year
Discover the total number of planes flying over this location in the year.
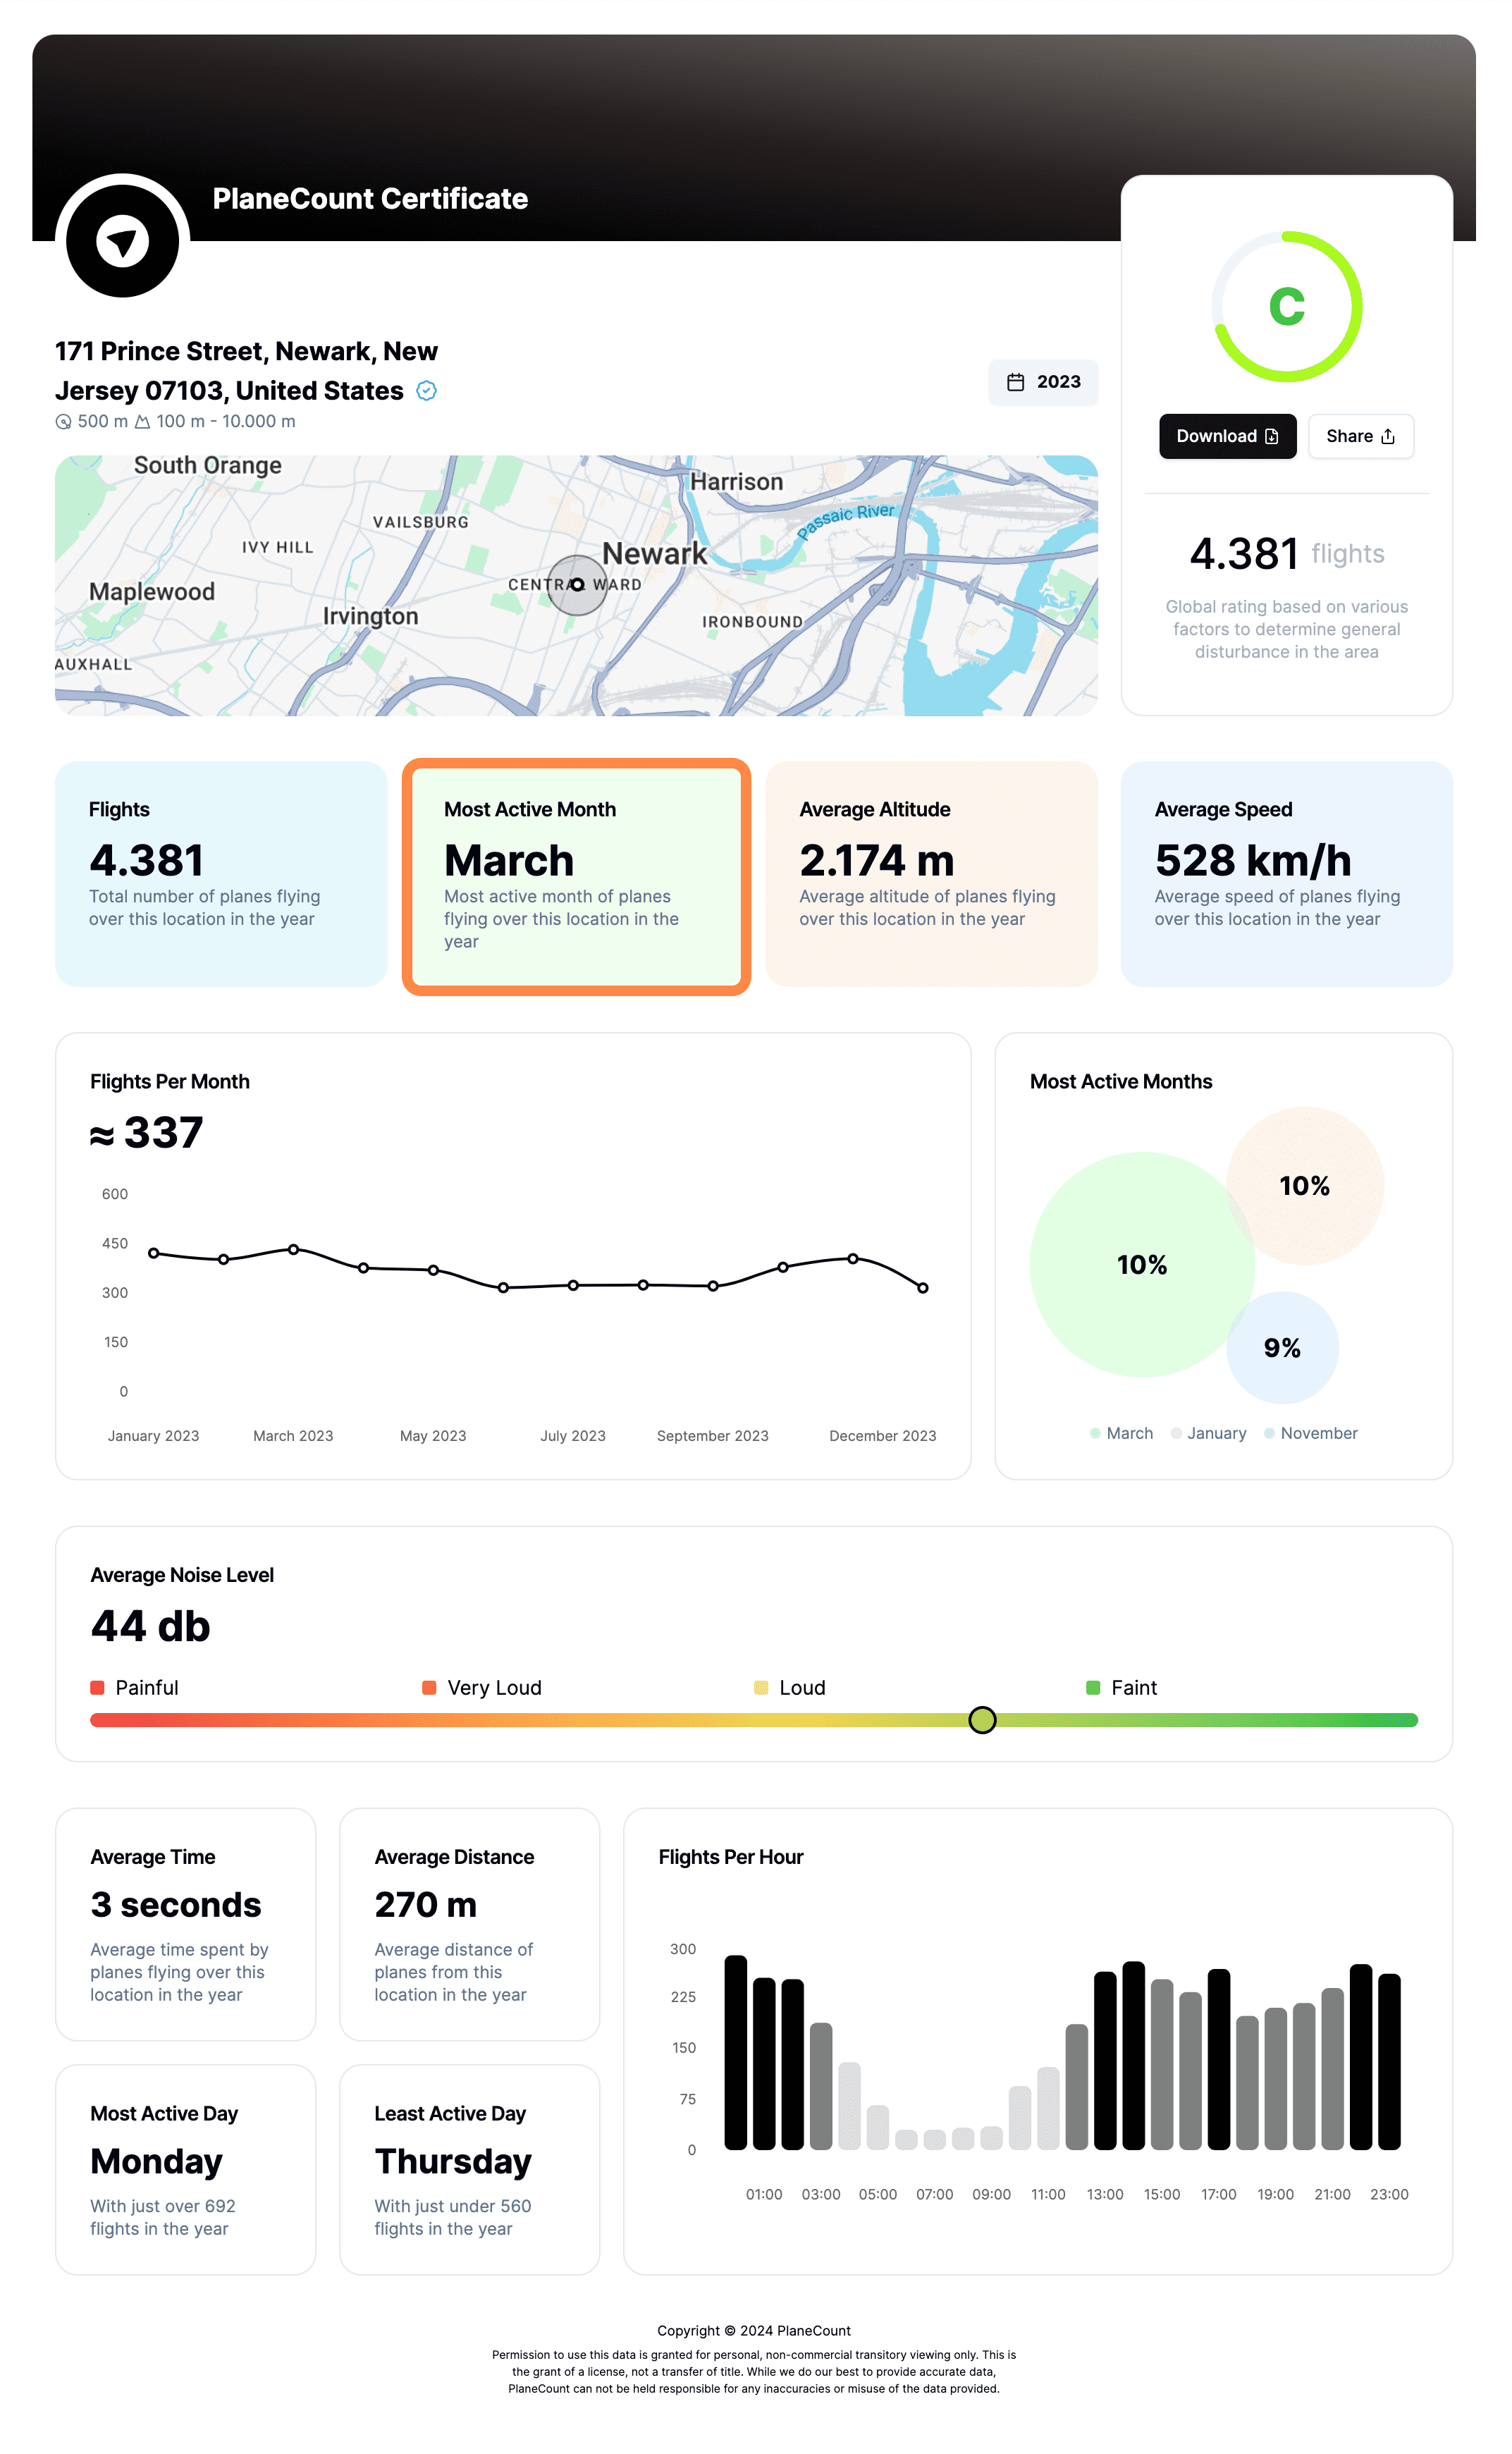
• Most active month
Discover the most active month of planes flying over this location in the year.
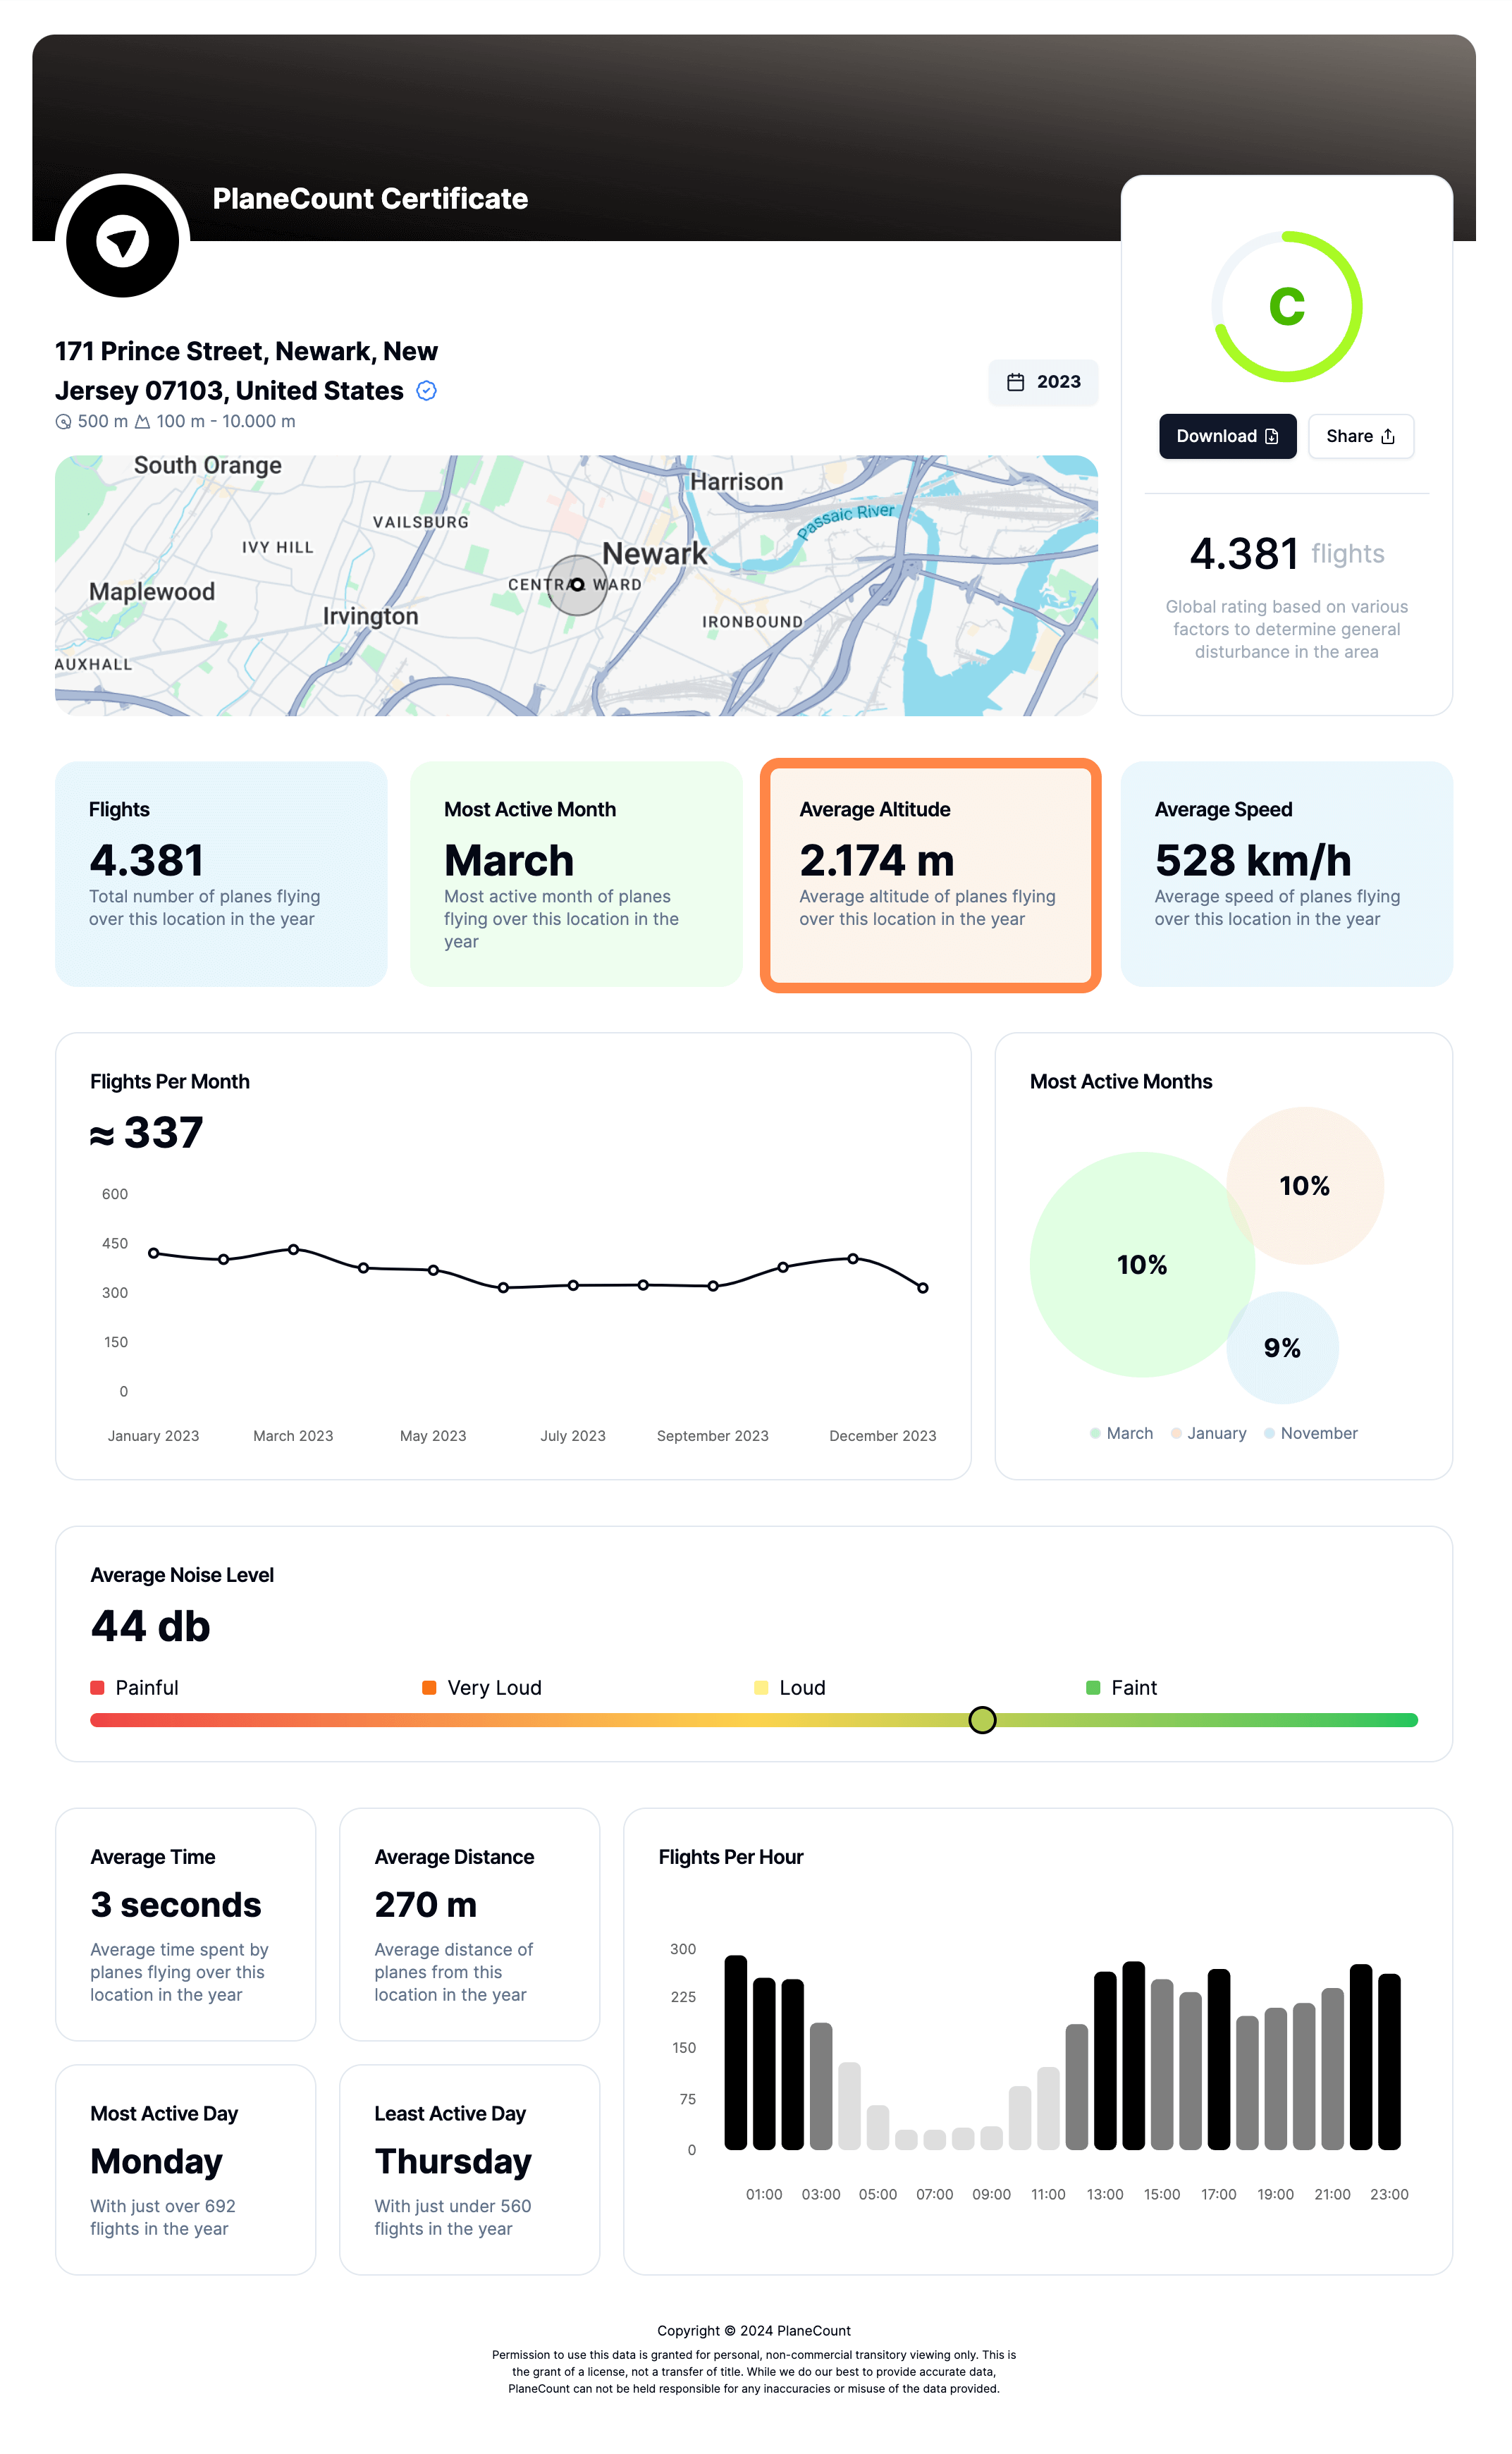
• Average altitude
Discover the average altitude of planes flying over this location in the year.
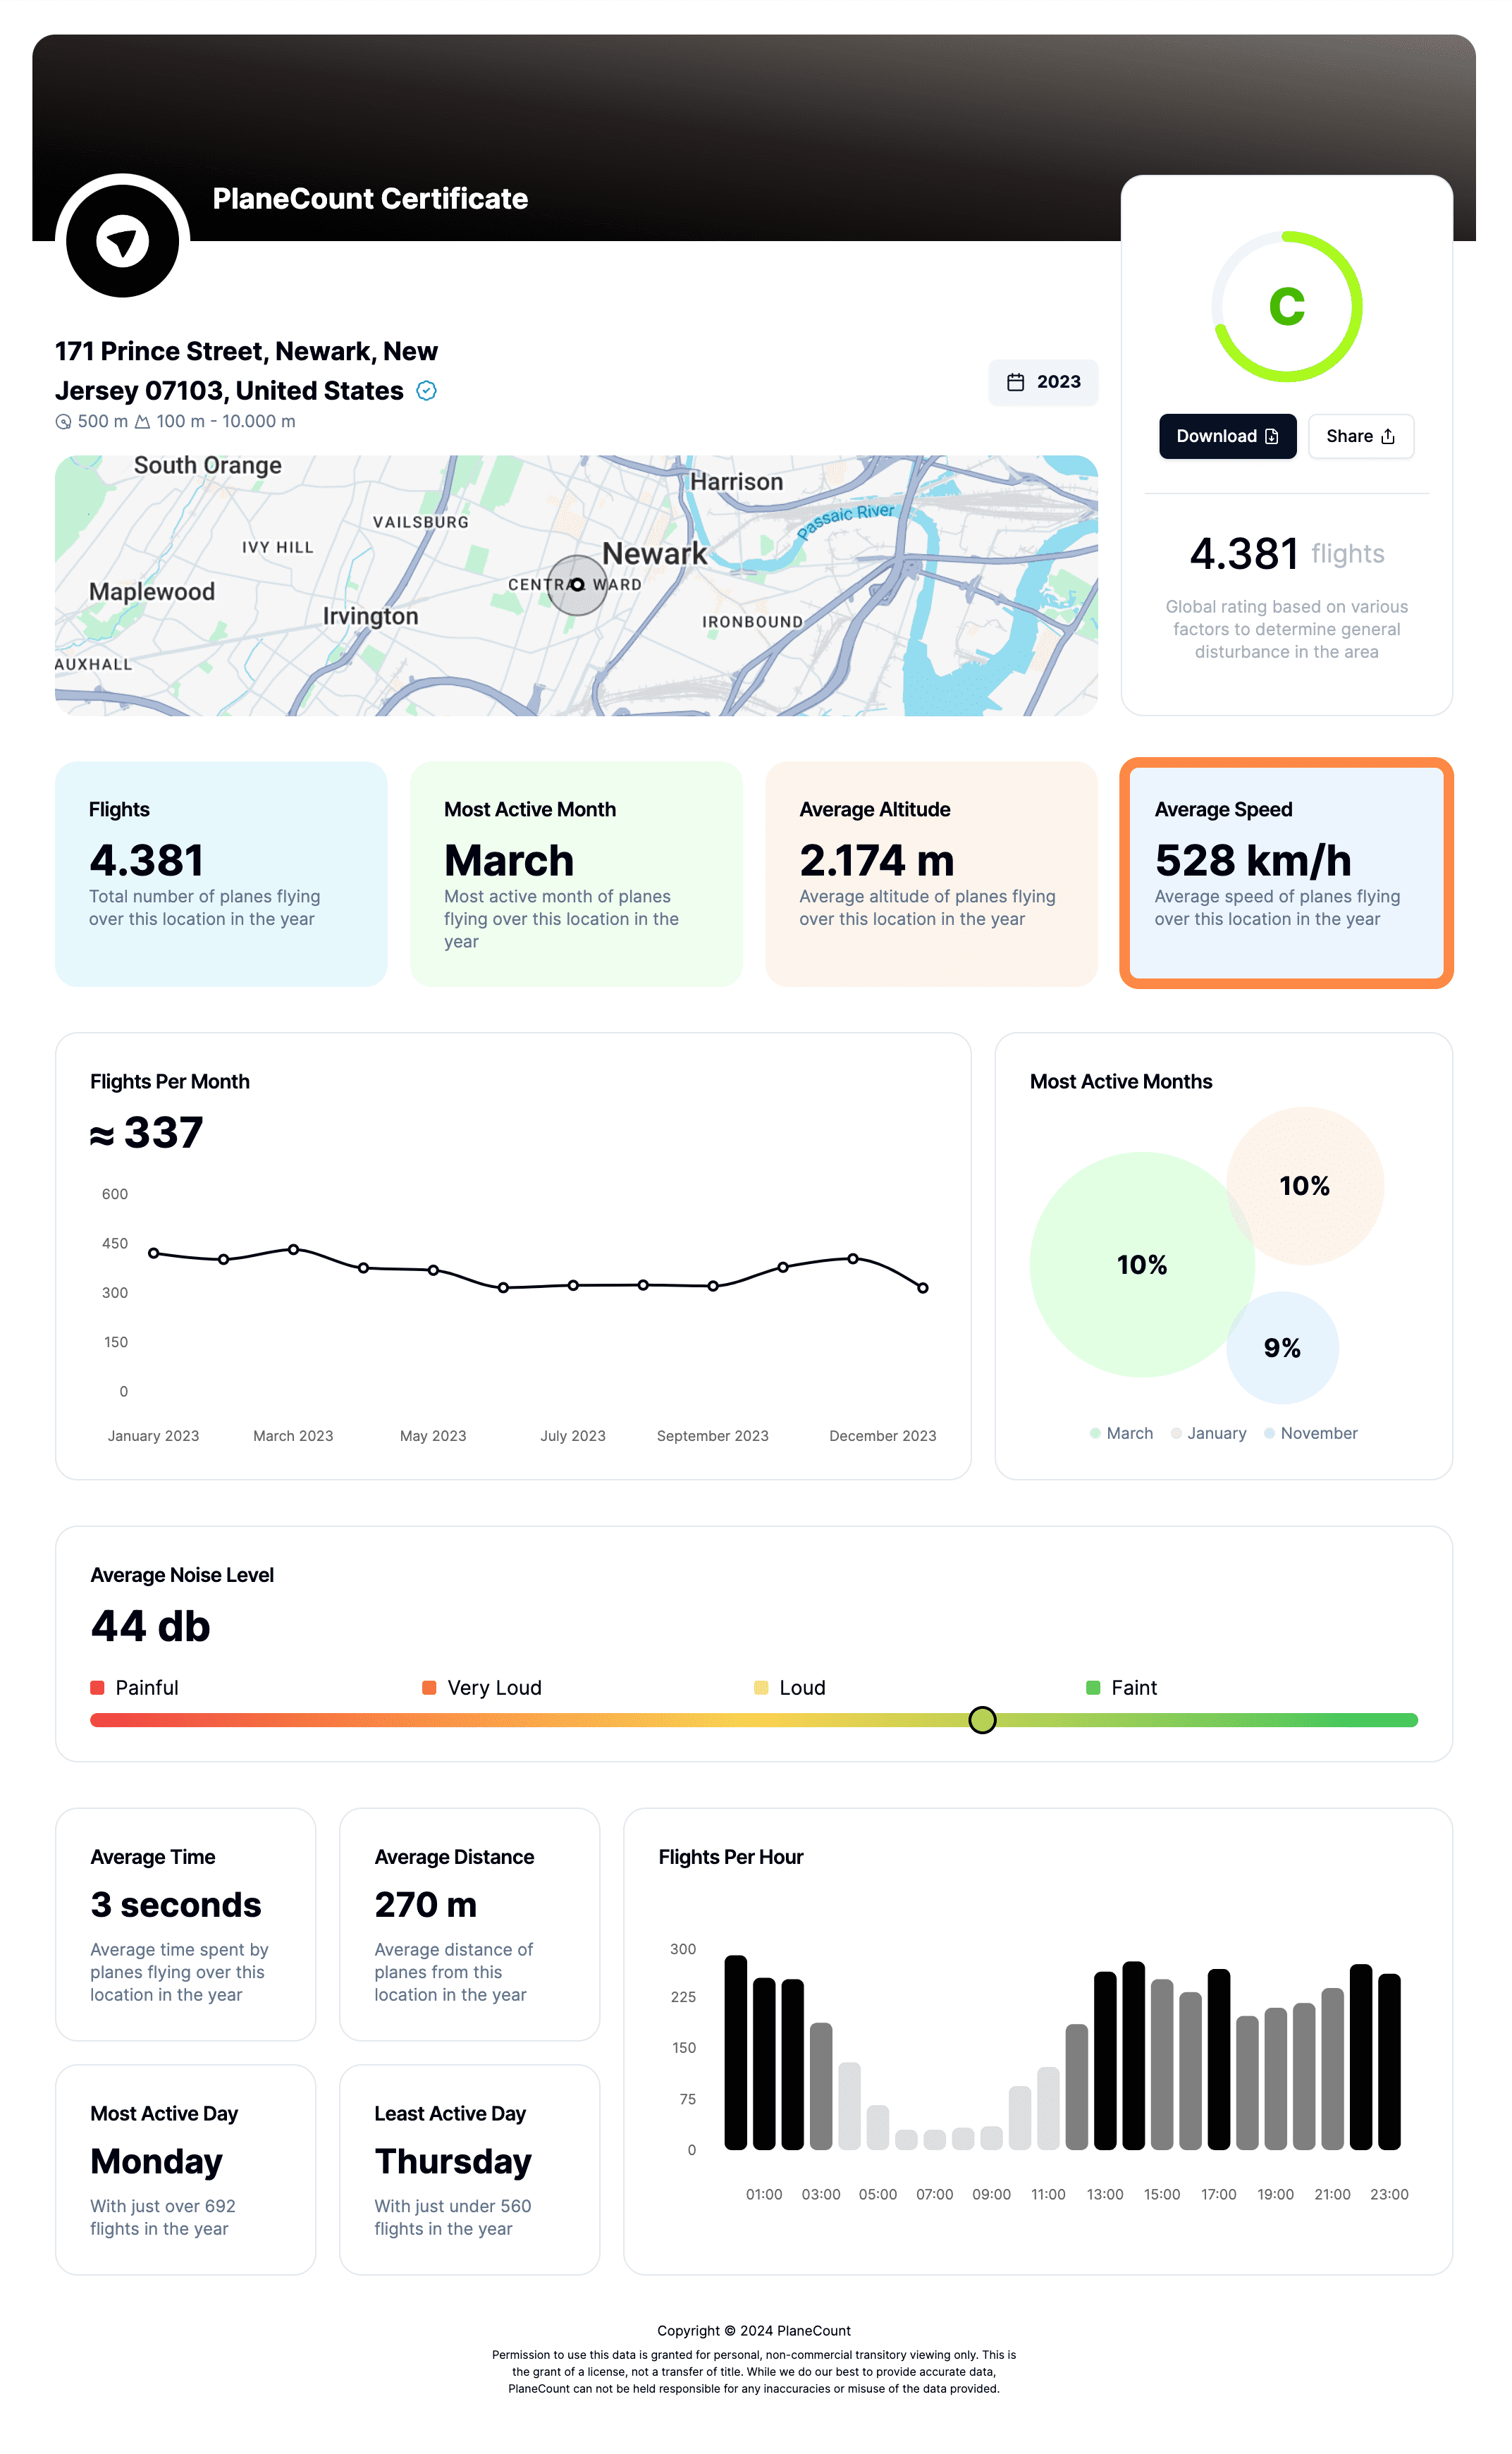
• Average speed
Discover the average speed of planes flying over this location in the year.
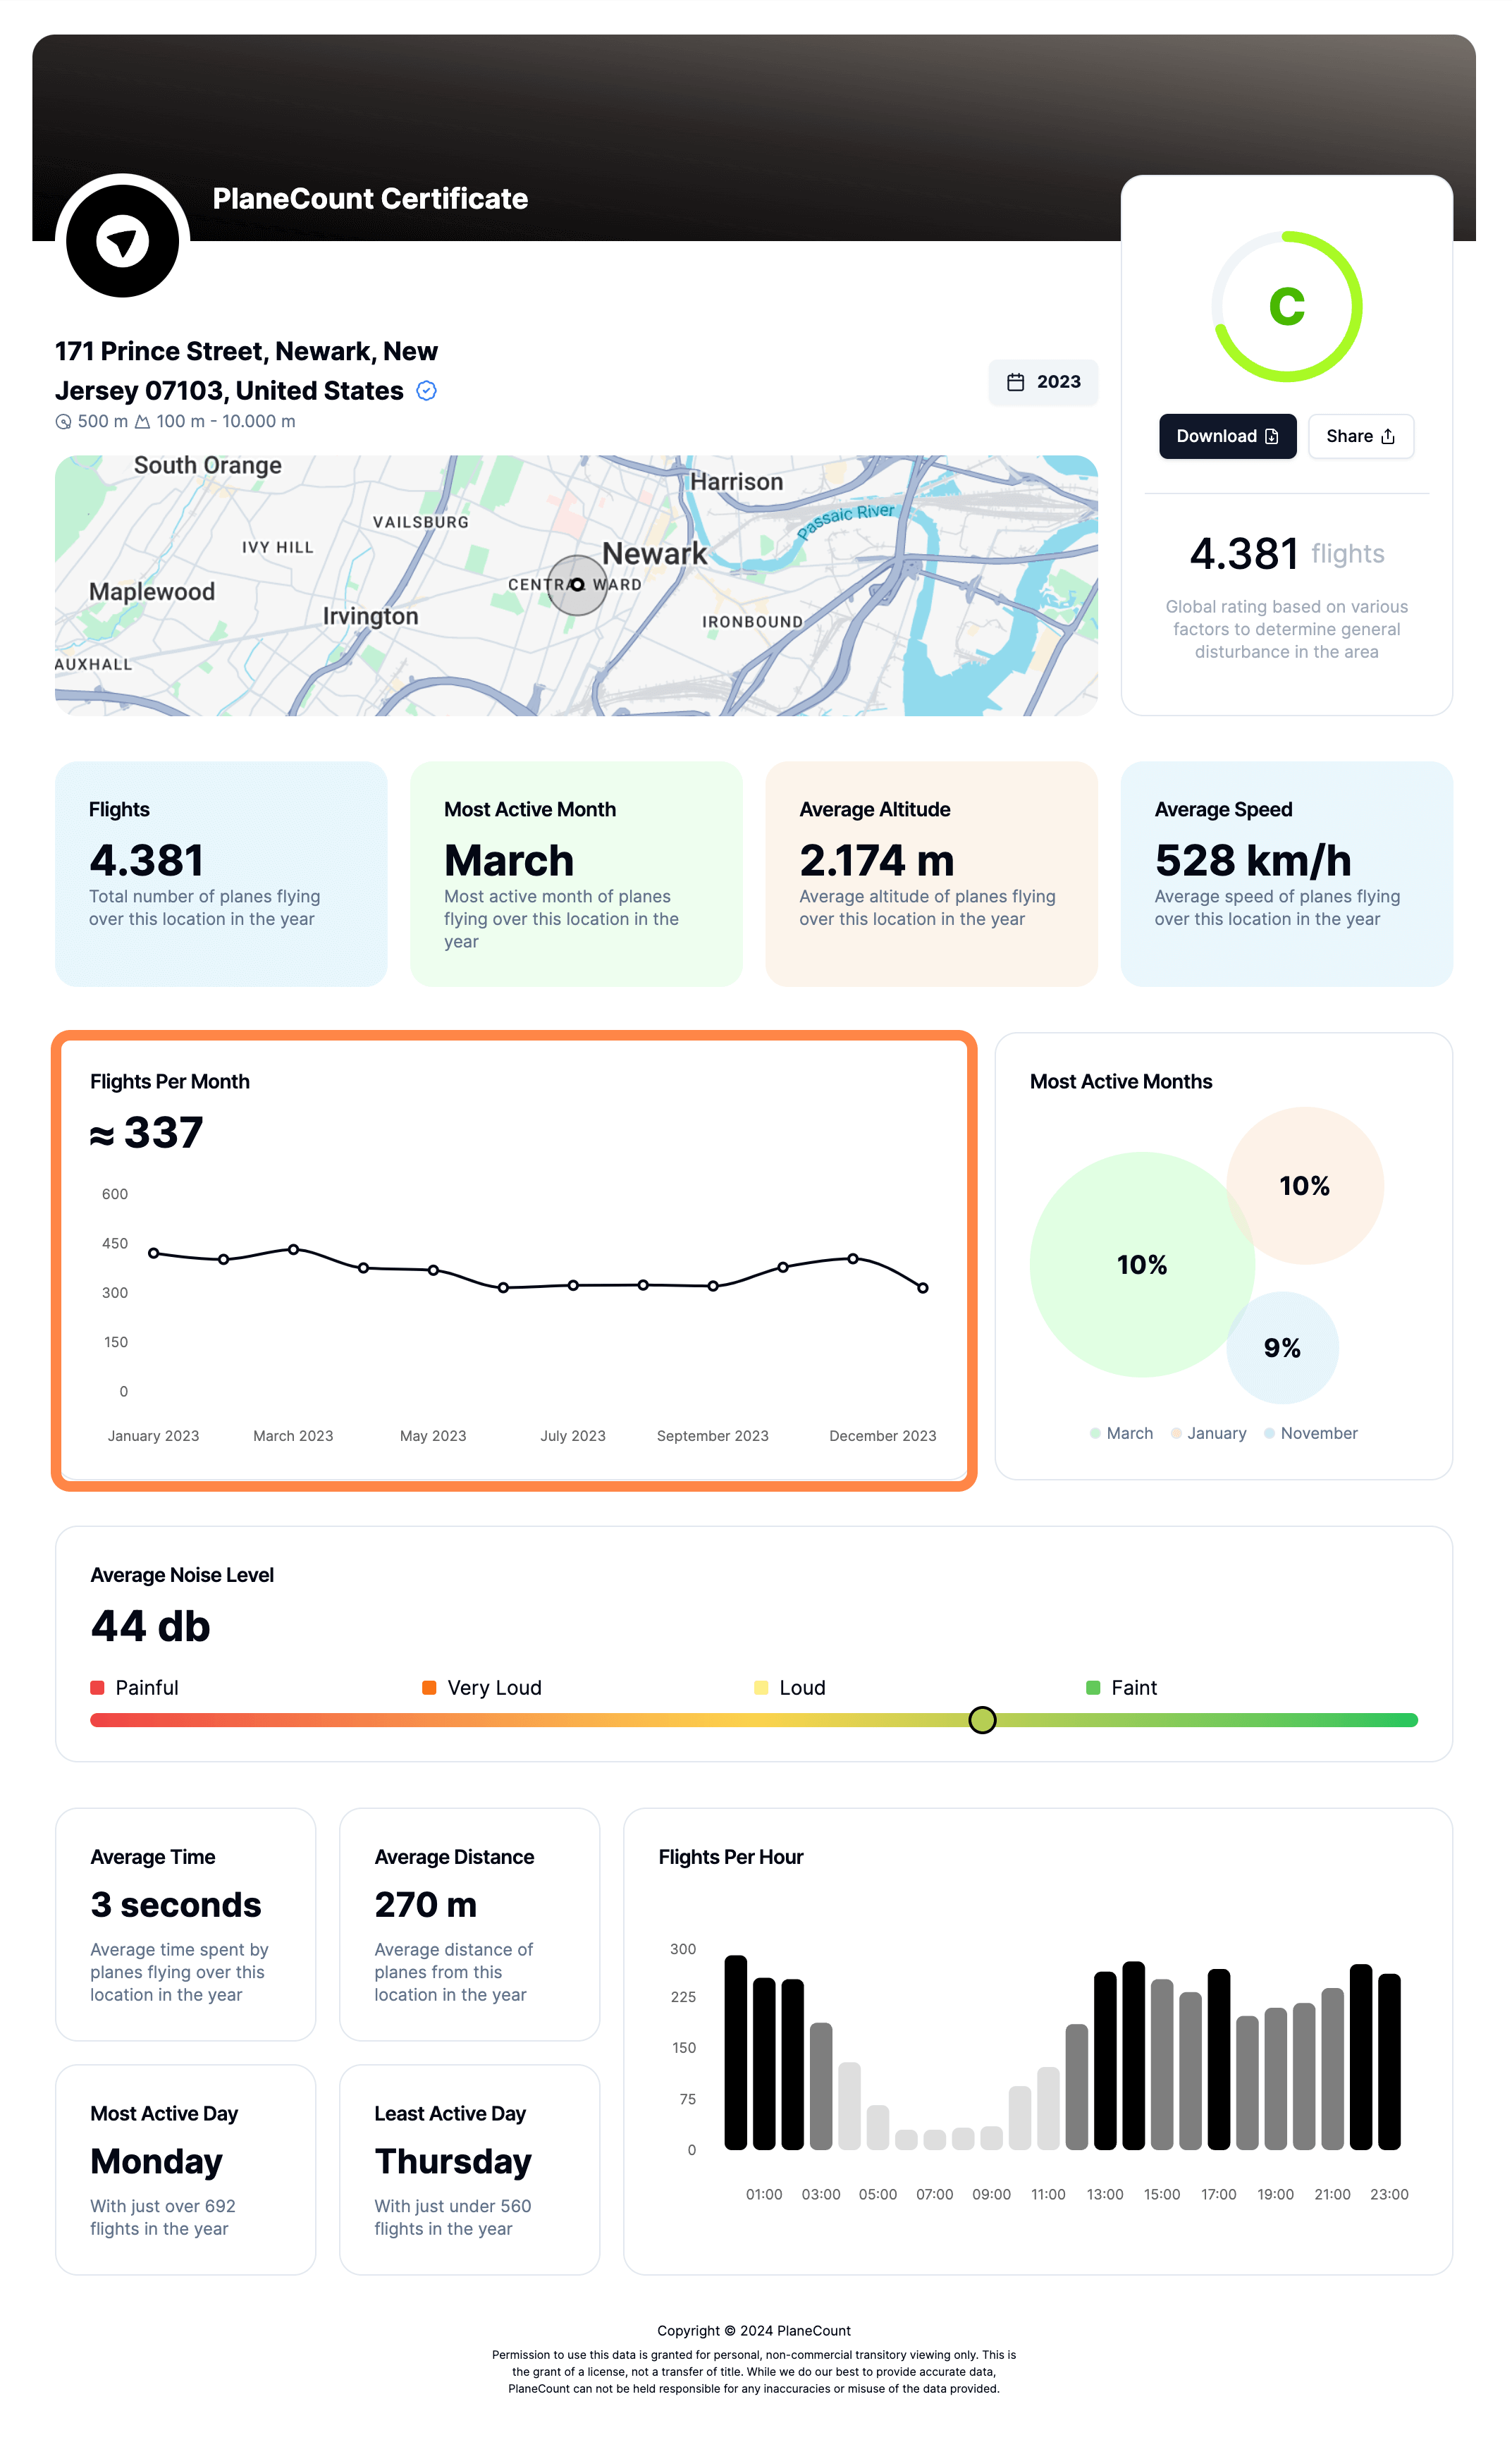
• Flights per month
Discover the monthly average number of planes flying over this location during the year.
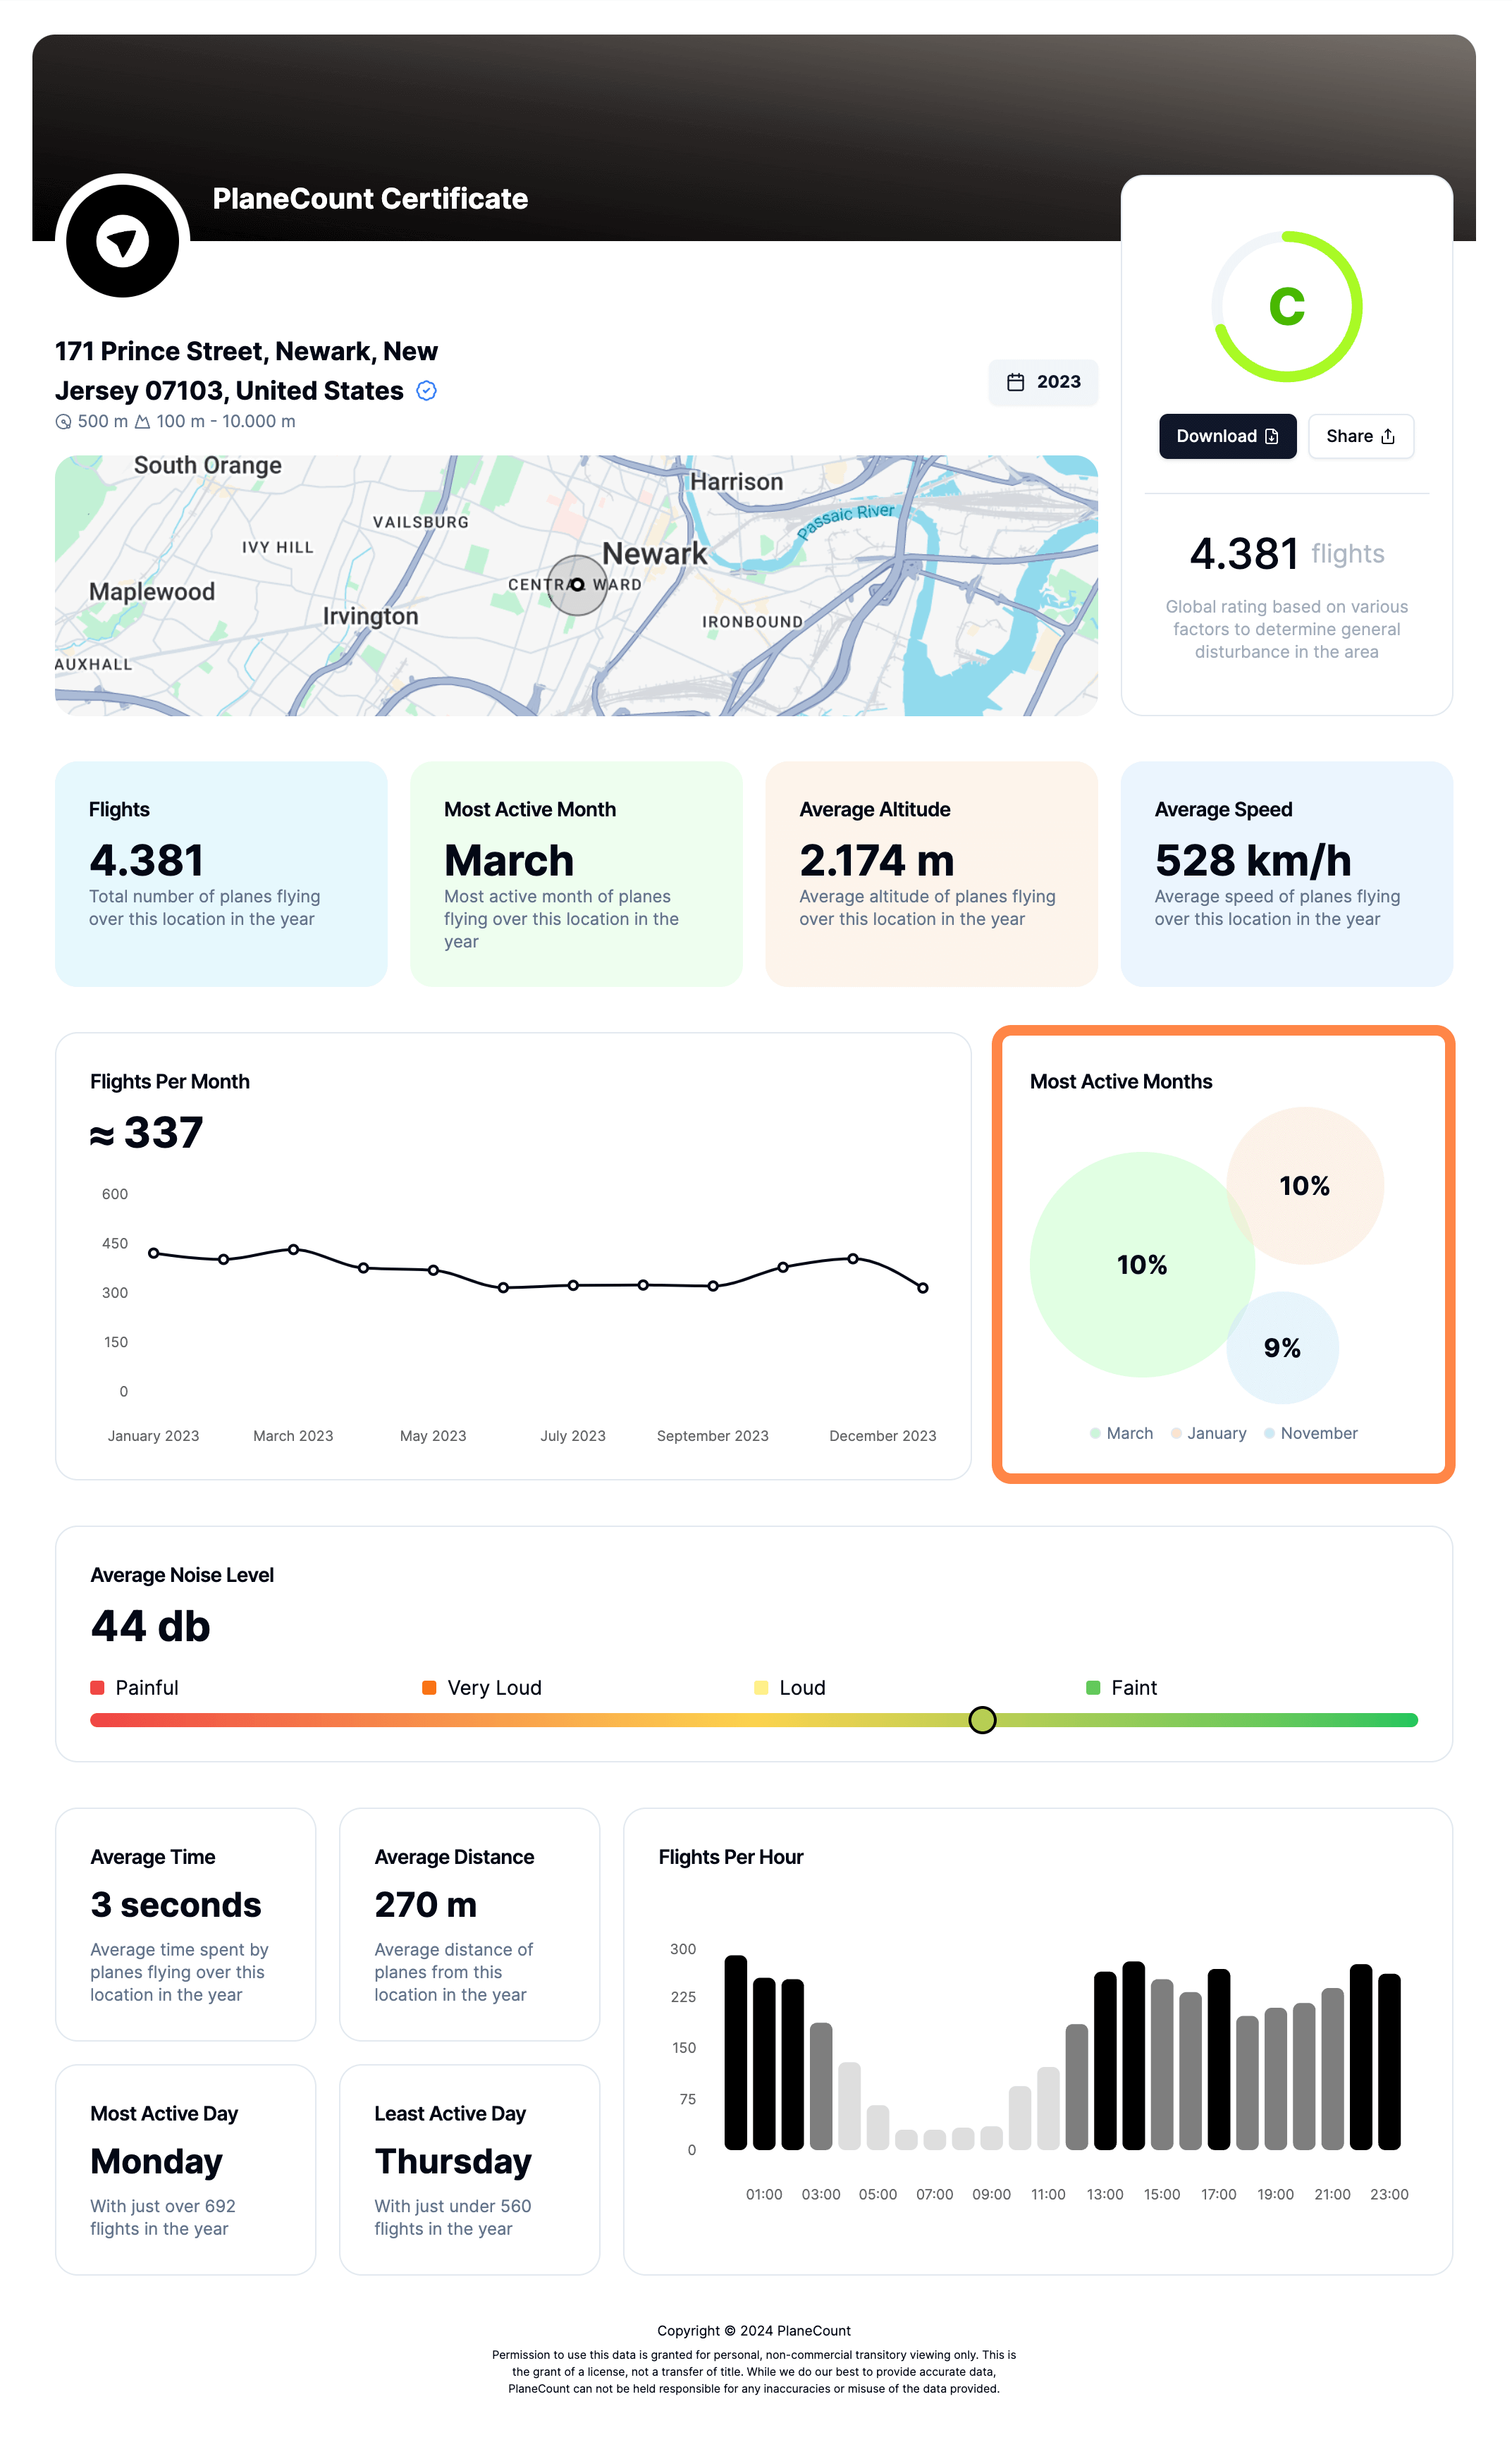
• Illustrated most active month
Discover the most active month of planes flying over this location in the year.
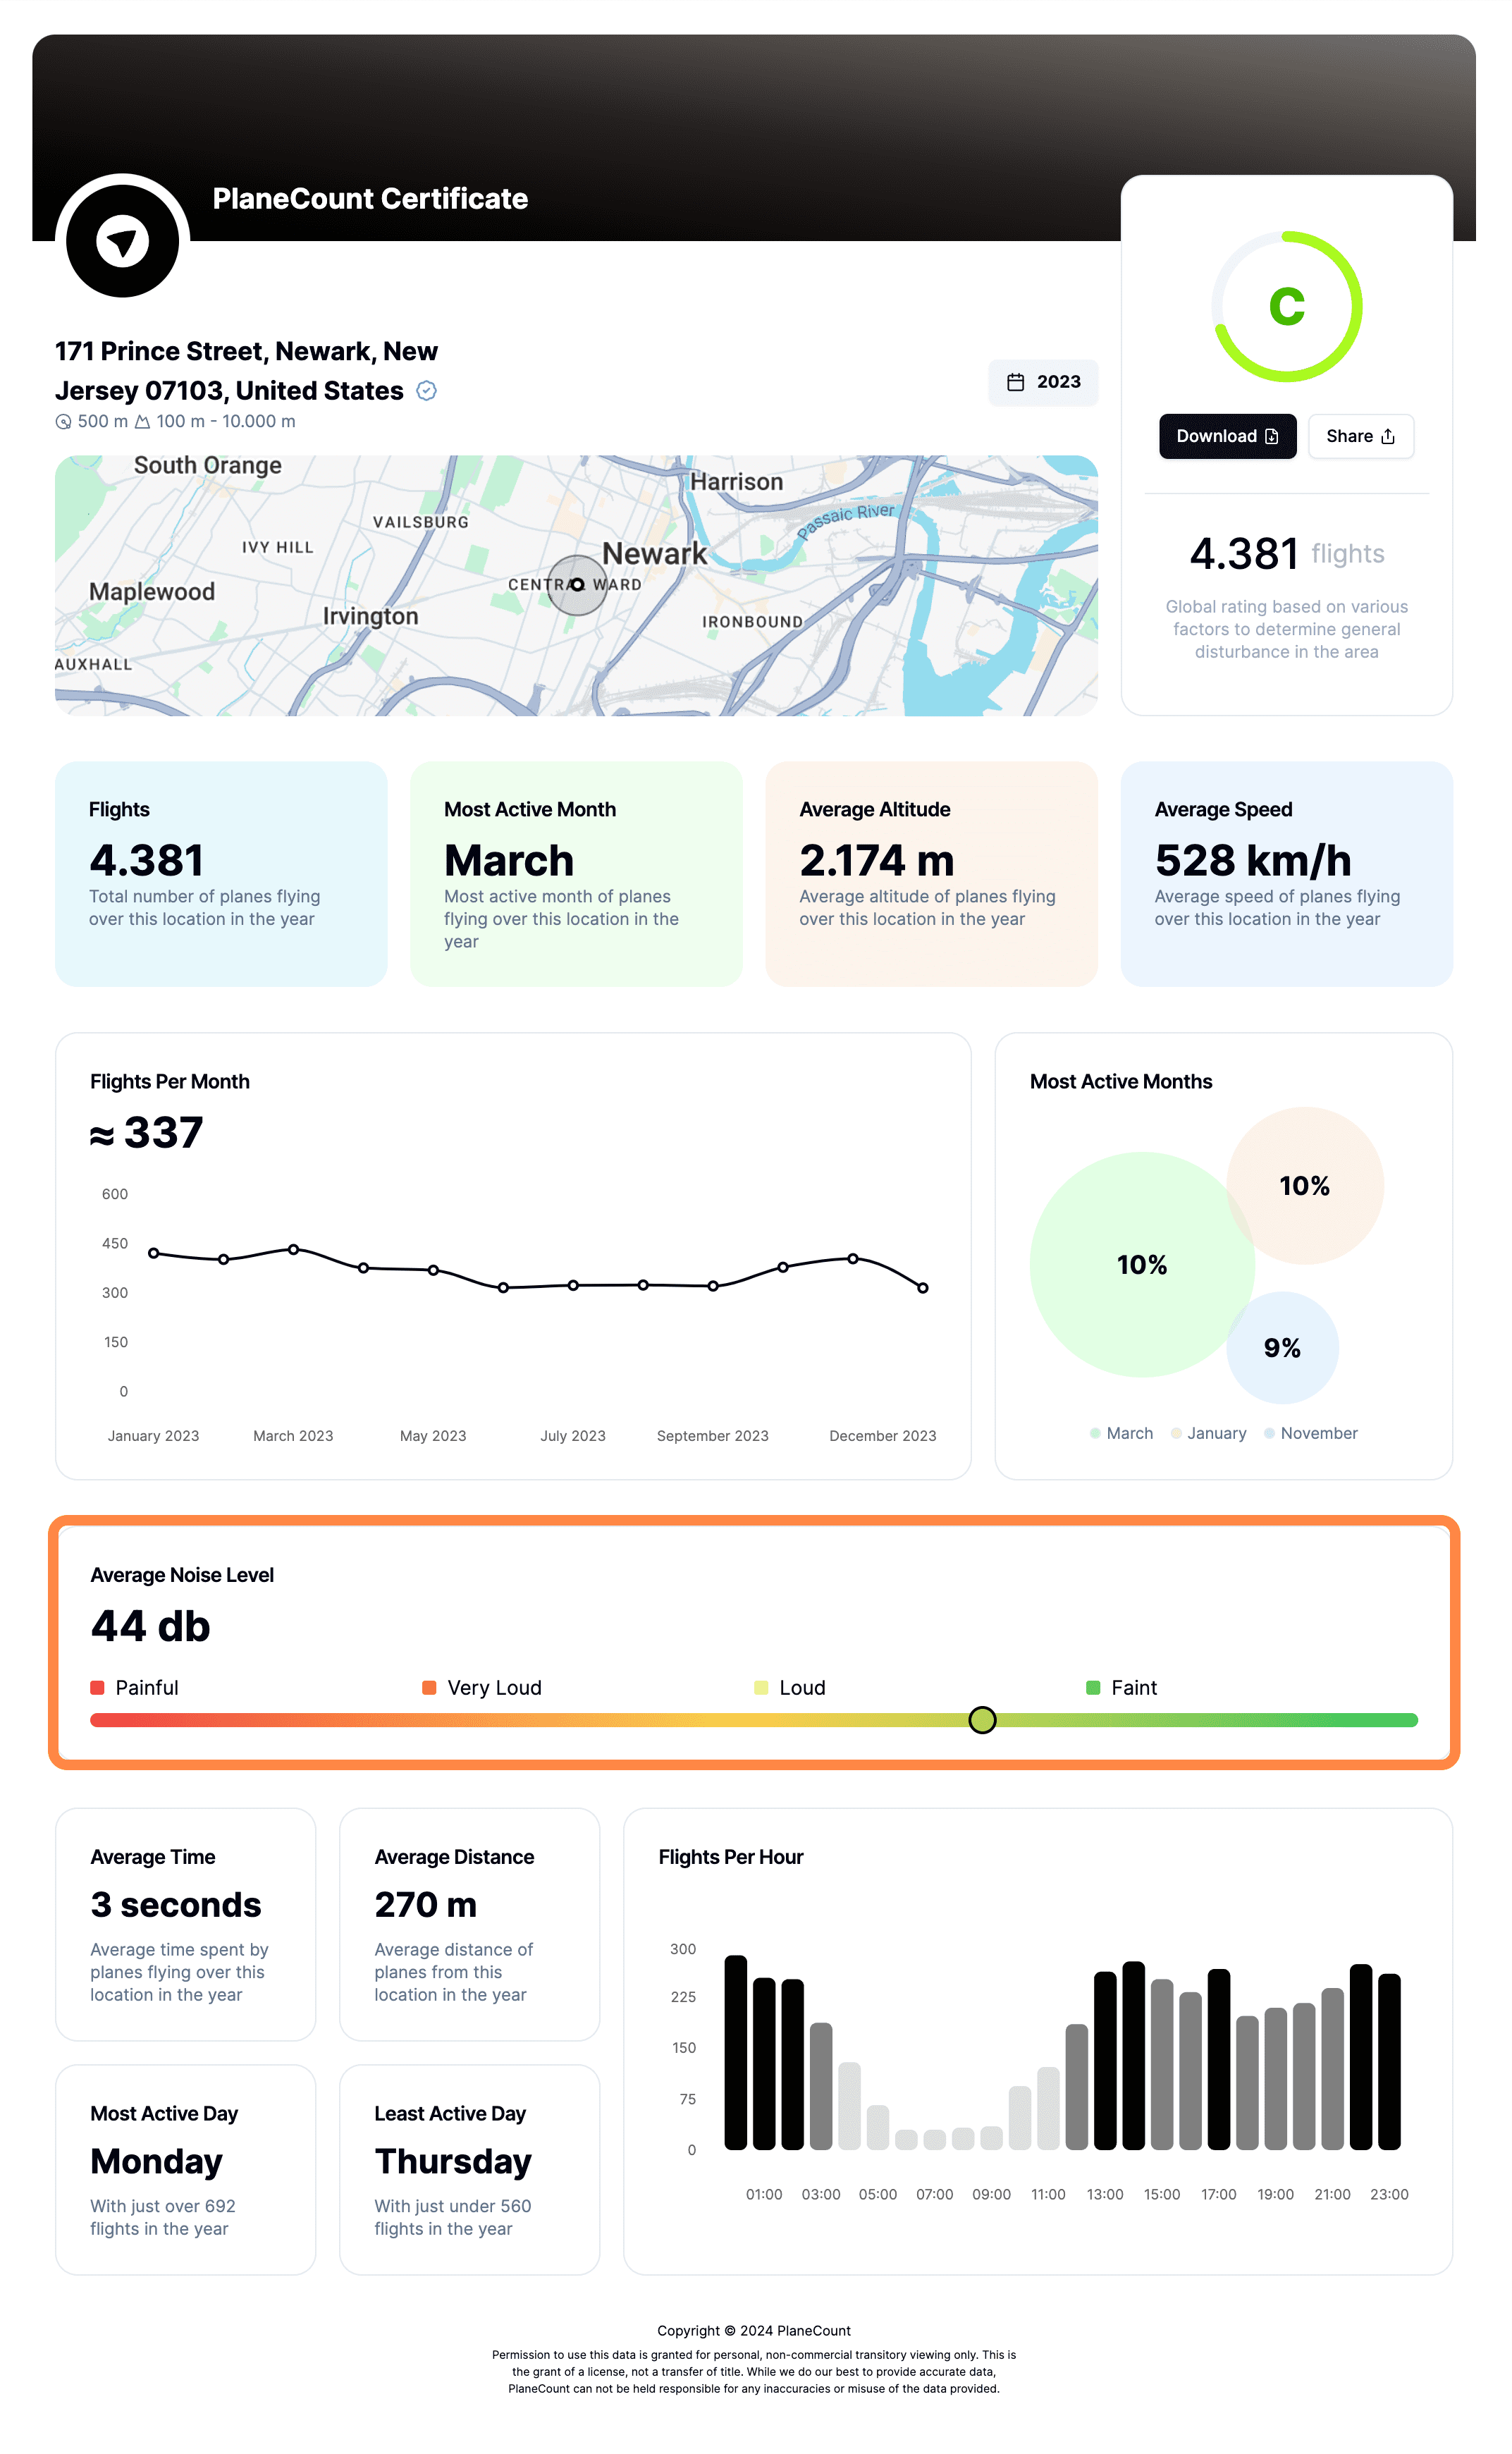
• Average noise level
Discover the average noise level of planes for this location.
The decibel scale measures sound from 0 dB (the quietest sound) to 140 dB (the point where sound causes pain). Sounds over 85 dB can harm your hearing, according to experts like NIOSH (the US National Institute for Occupational Safety and Health).
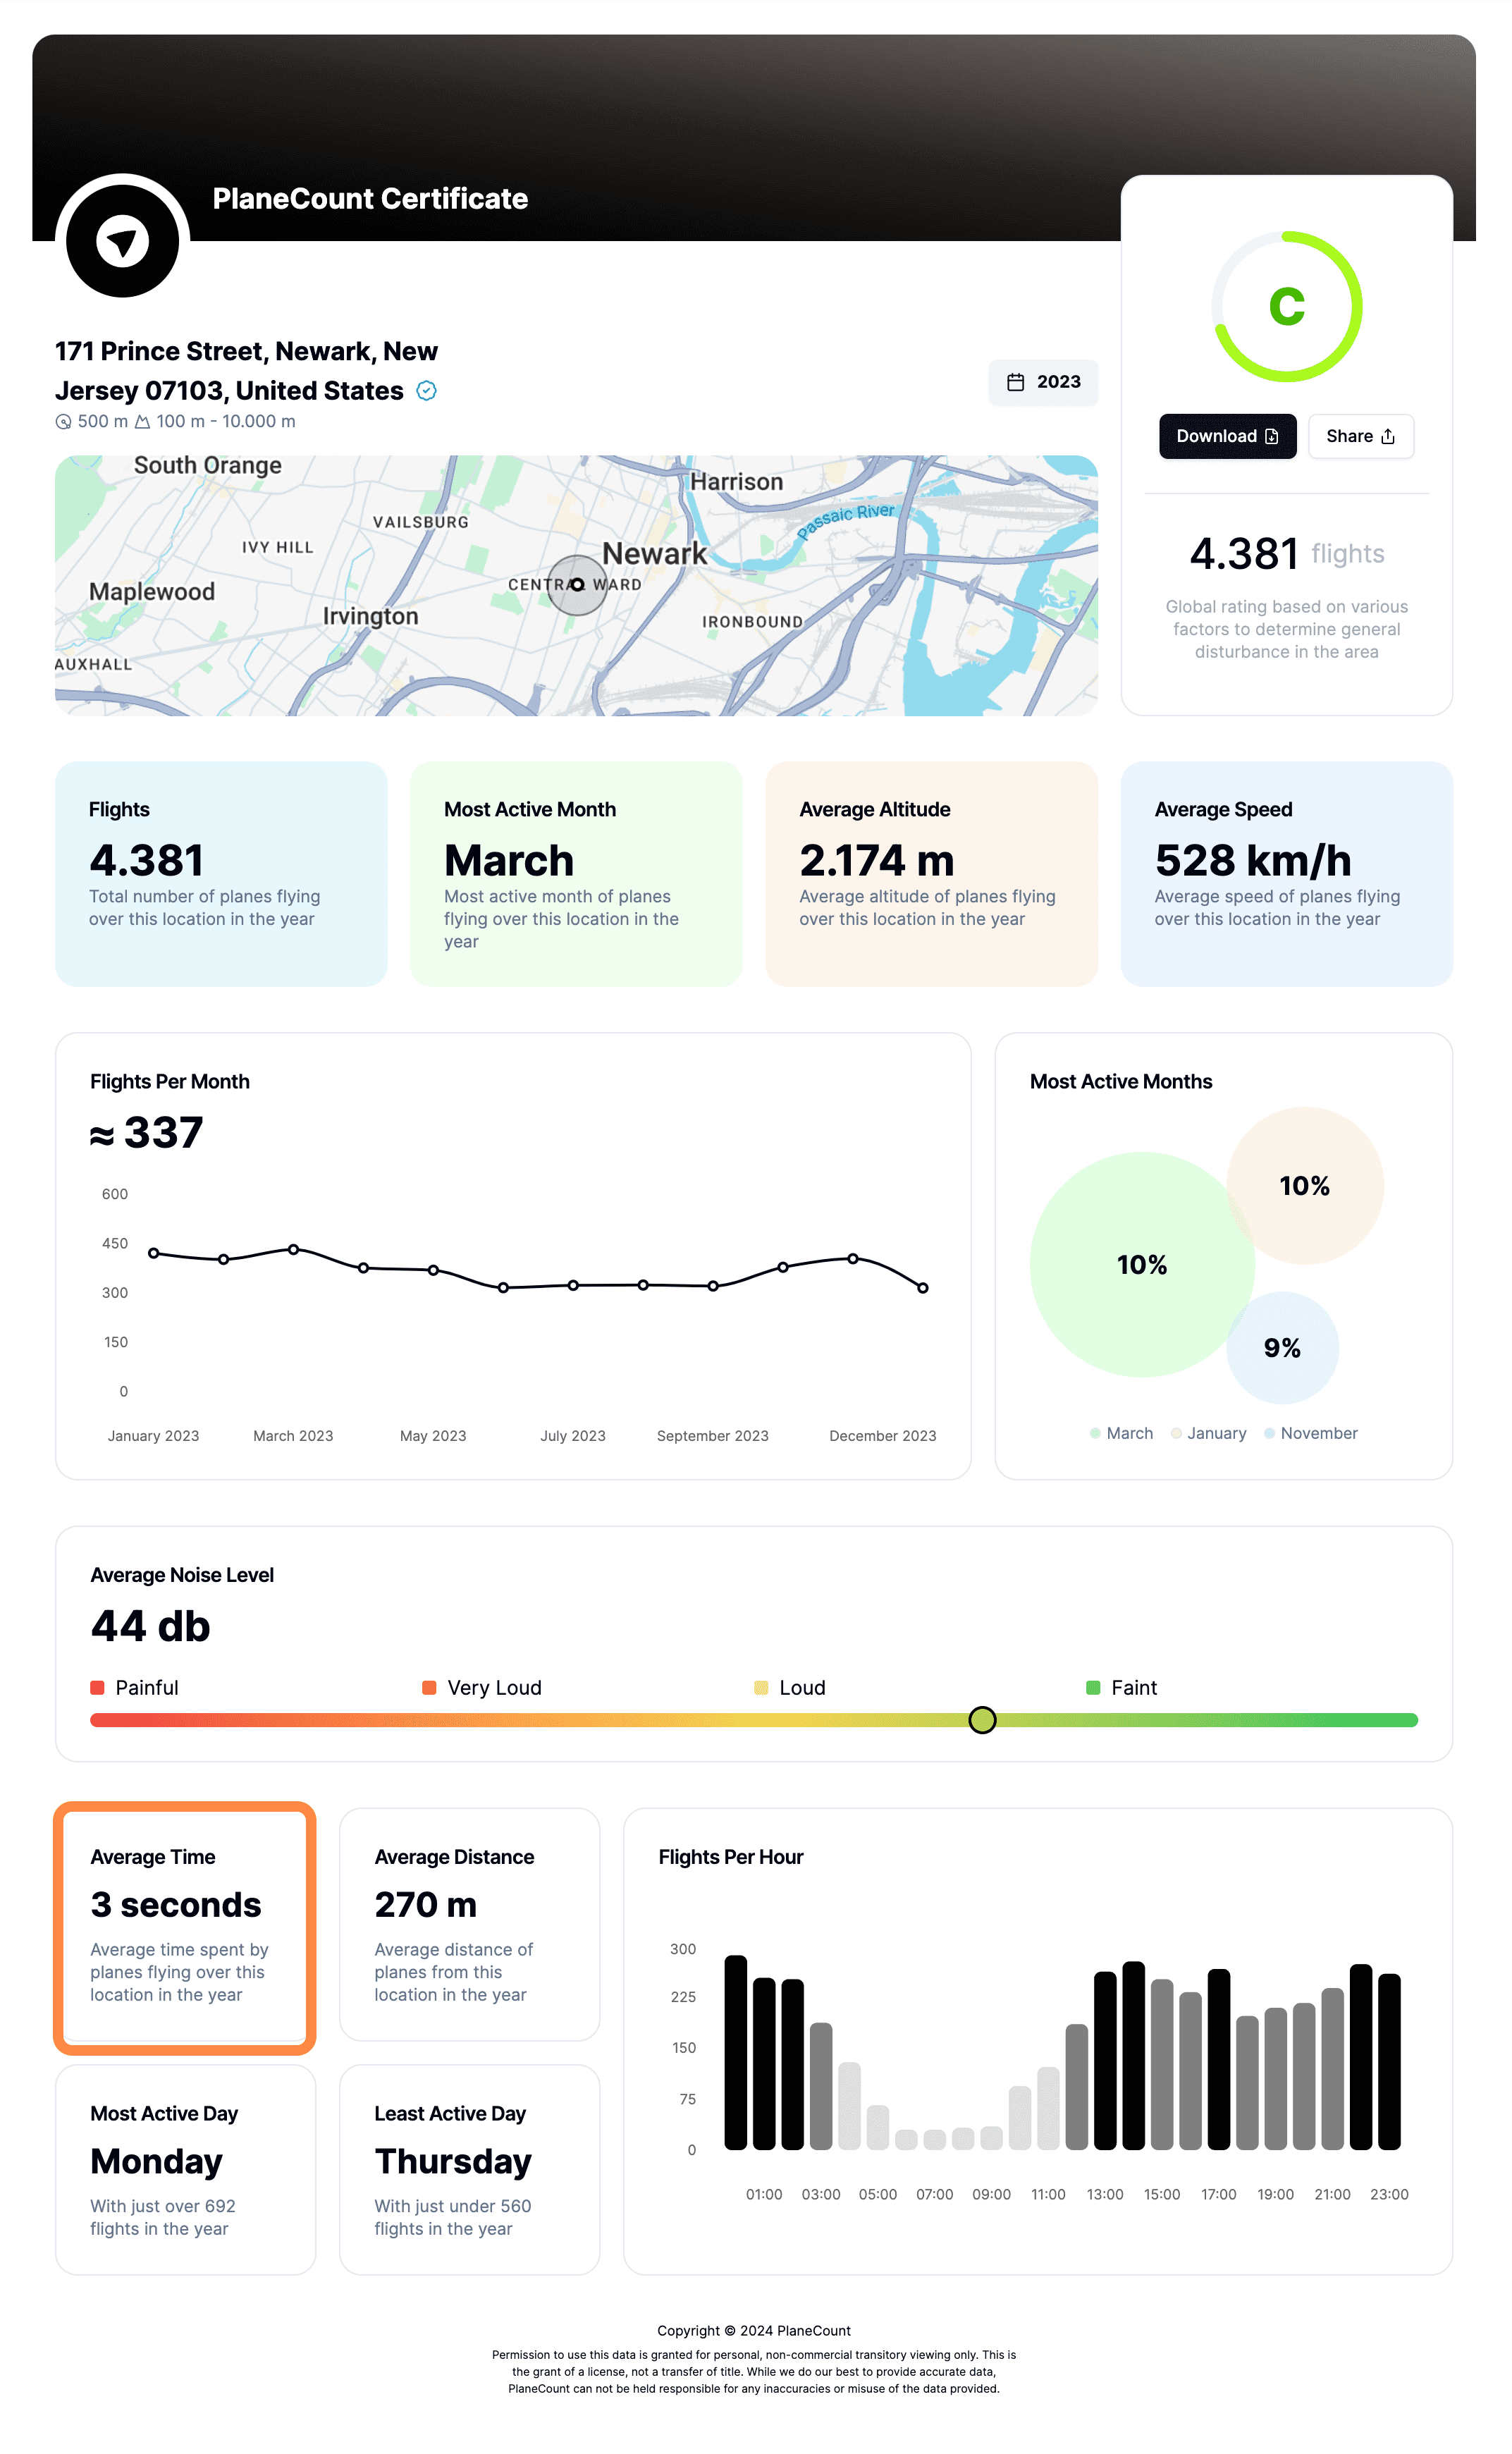
• Average time
Discoever the average time spent by planes flying over this location in the year.
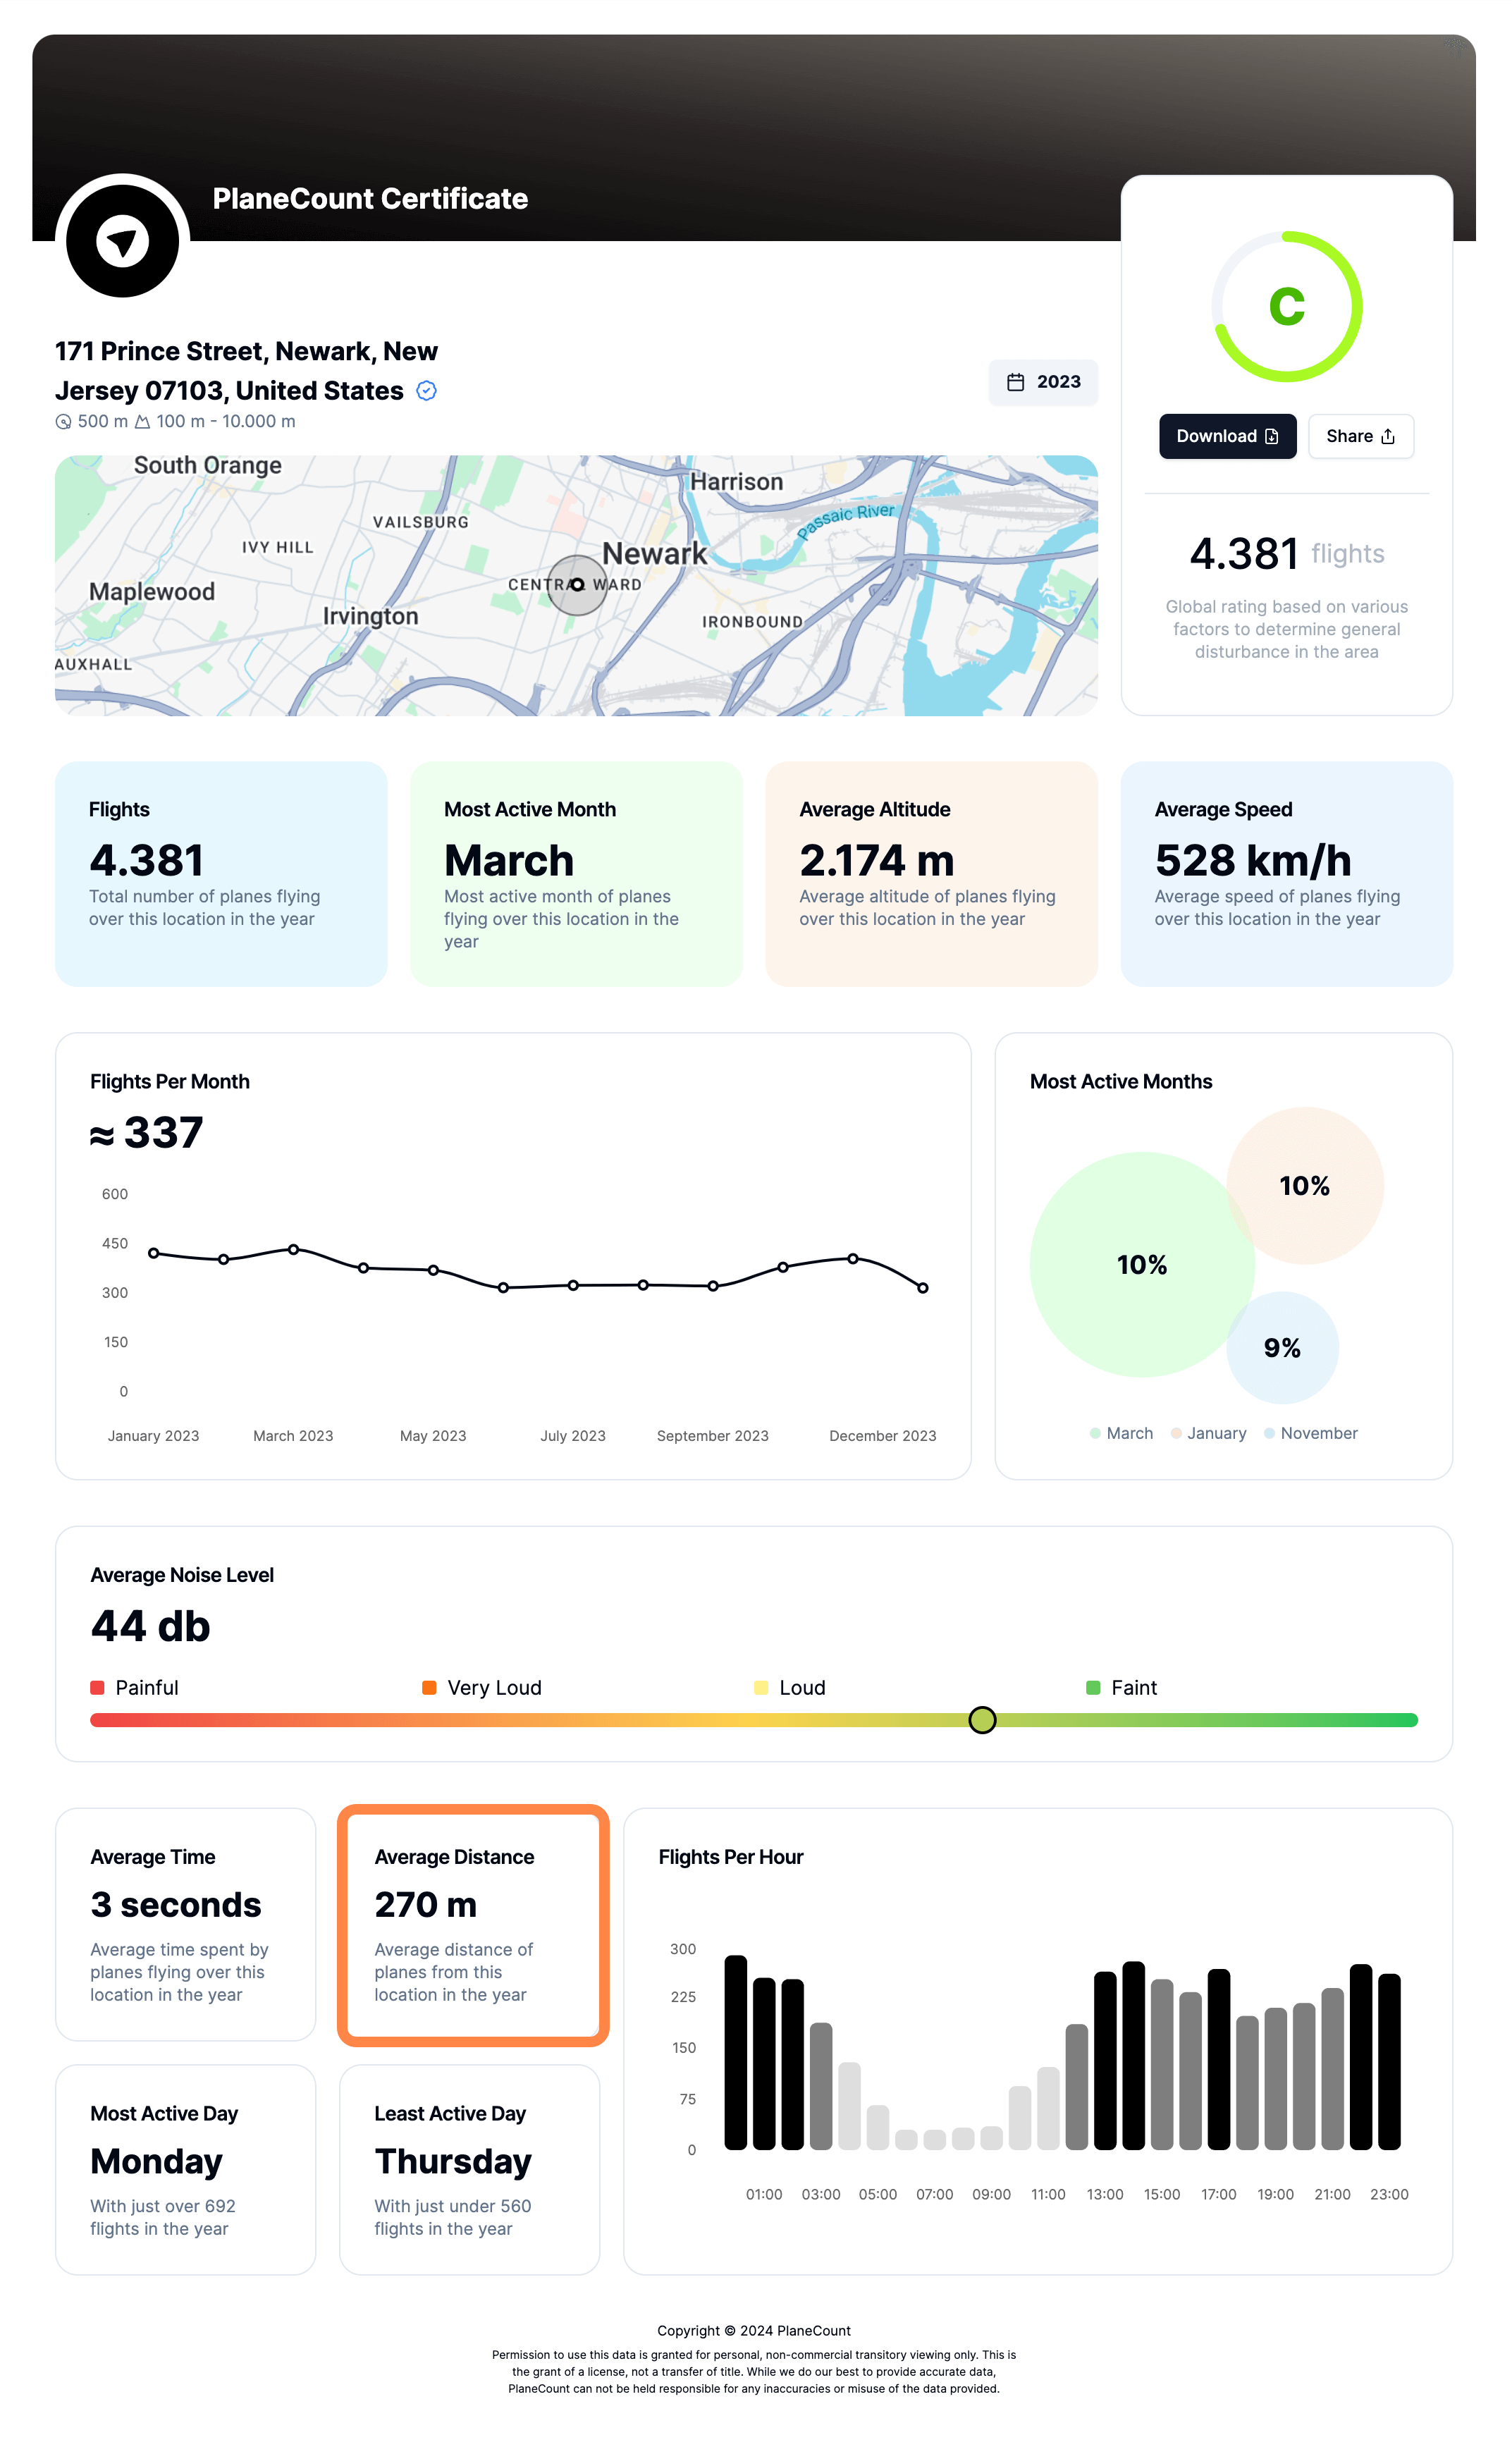
• Average distance
Discover the average distance of planes from this location in the year
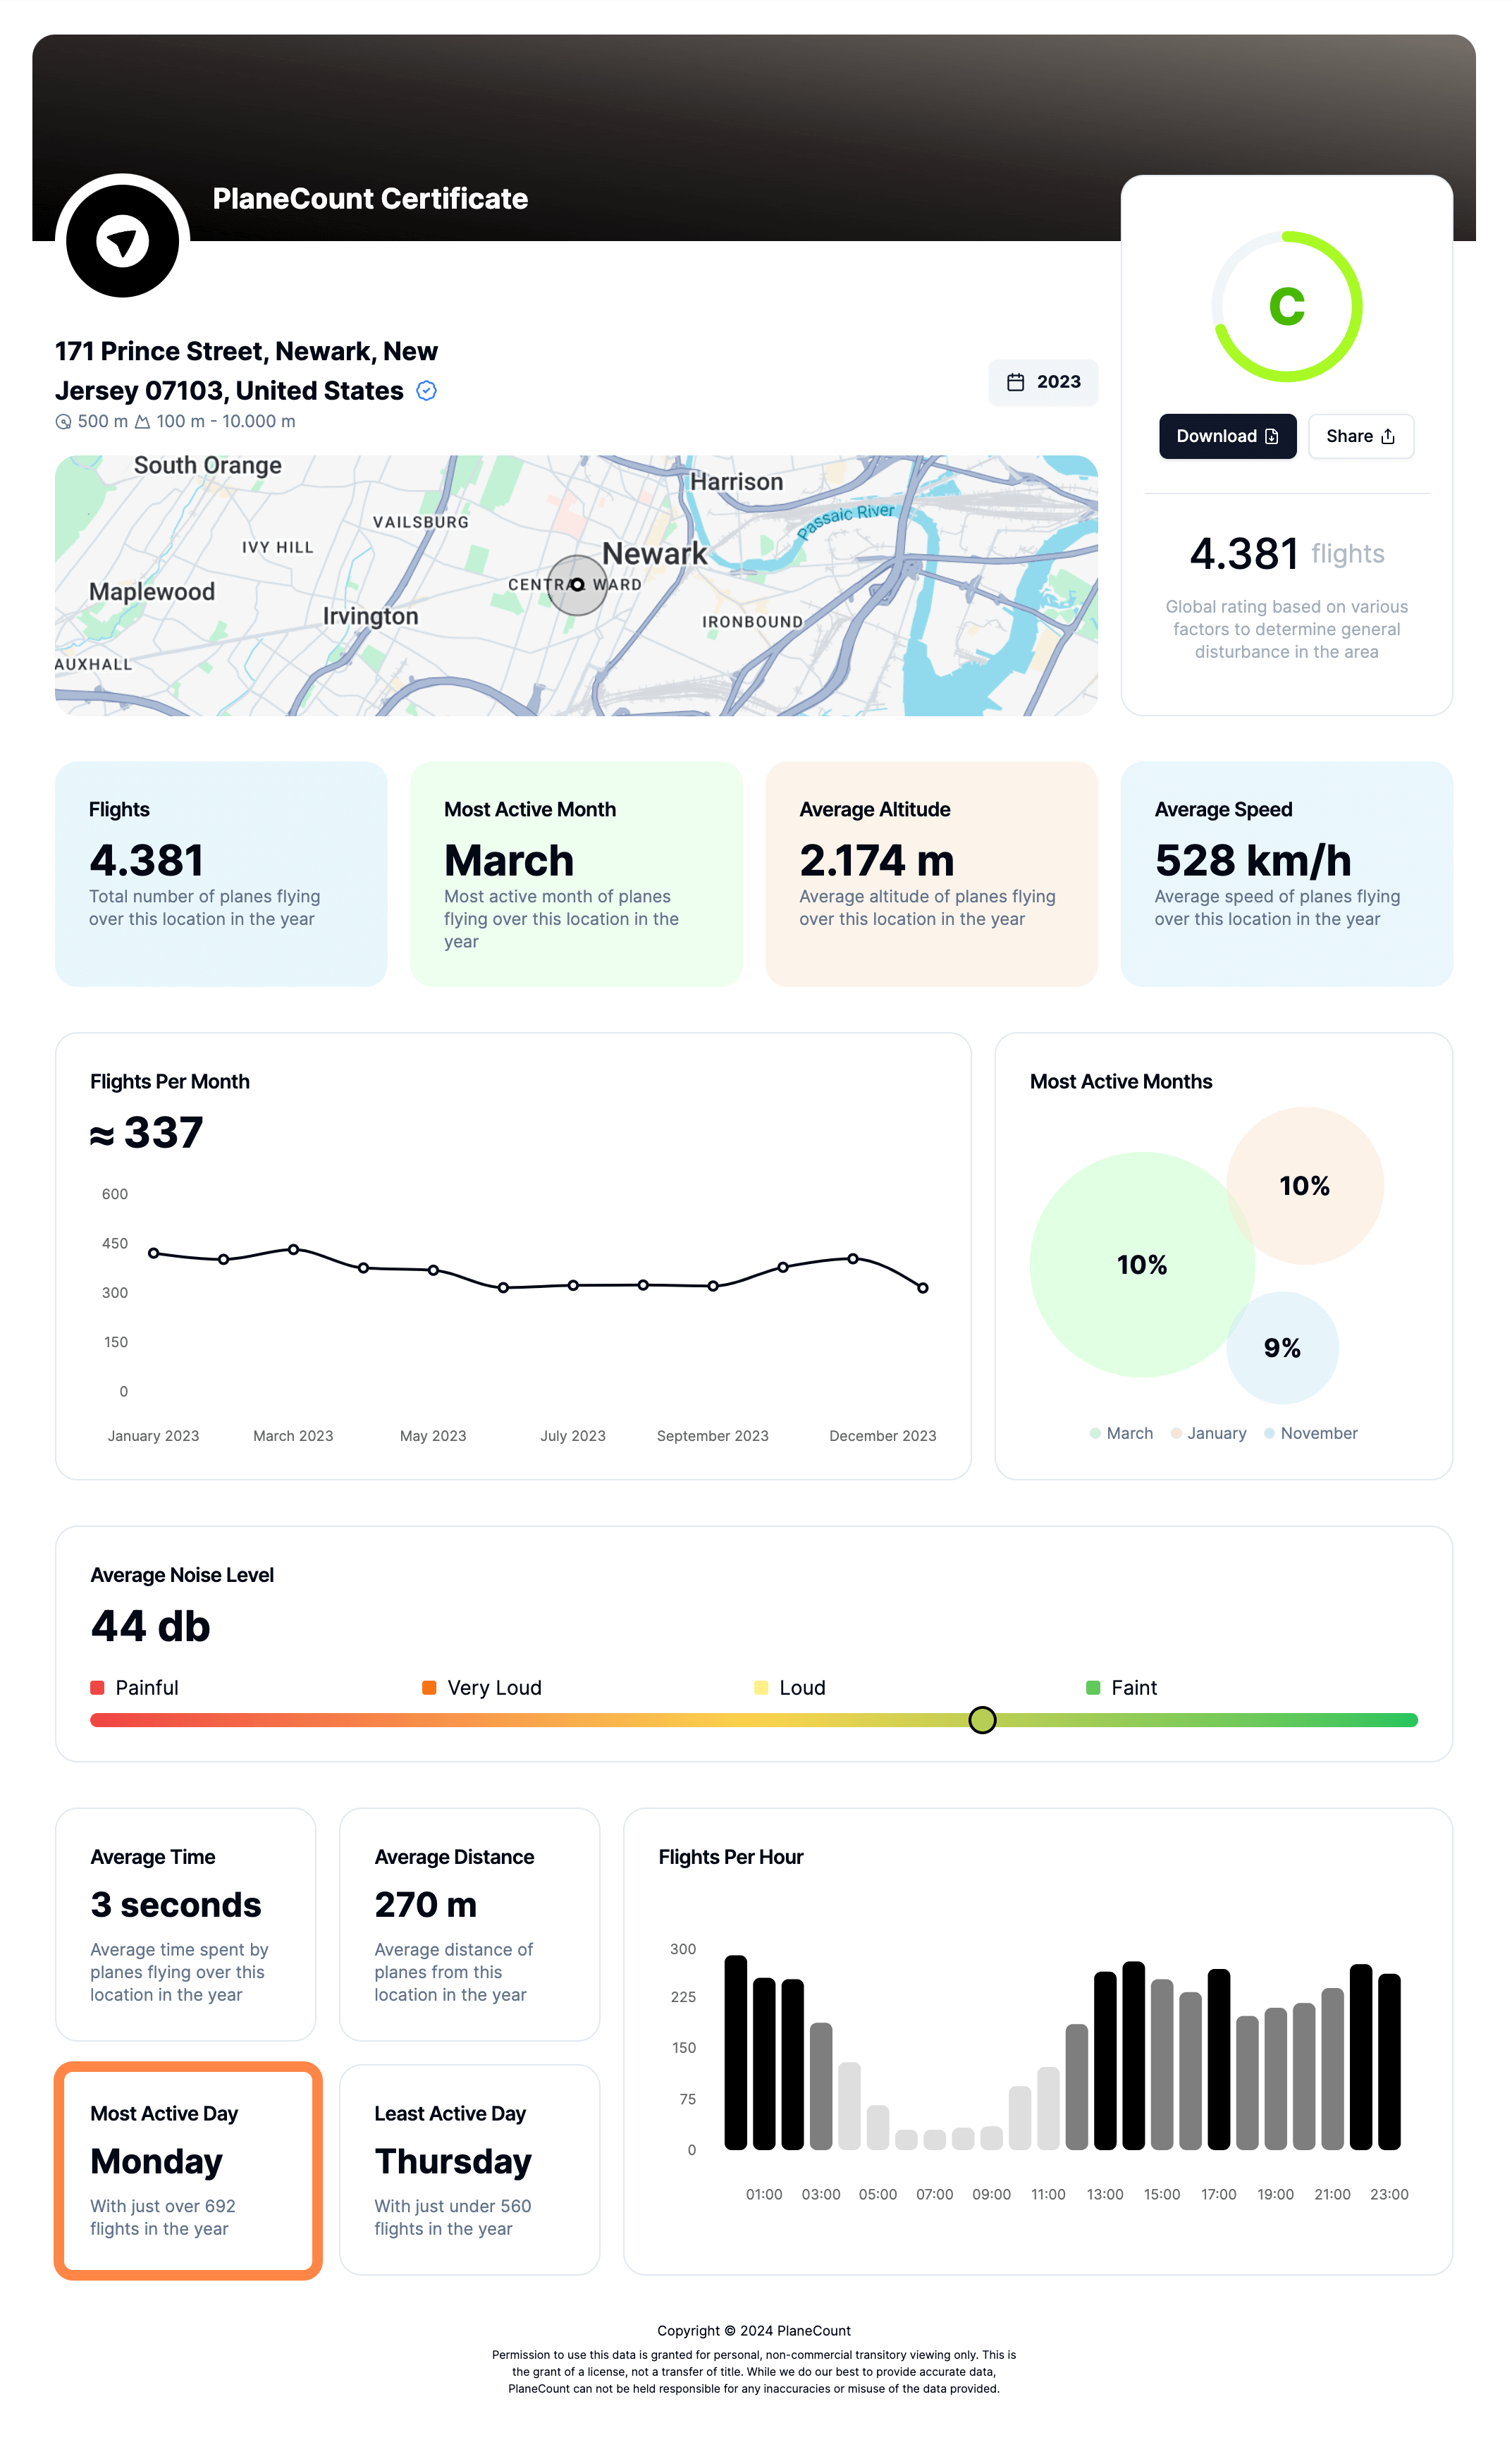
• Most active day
Discover the most active day in the week for this location.
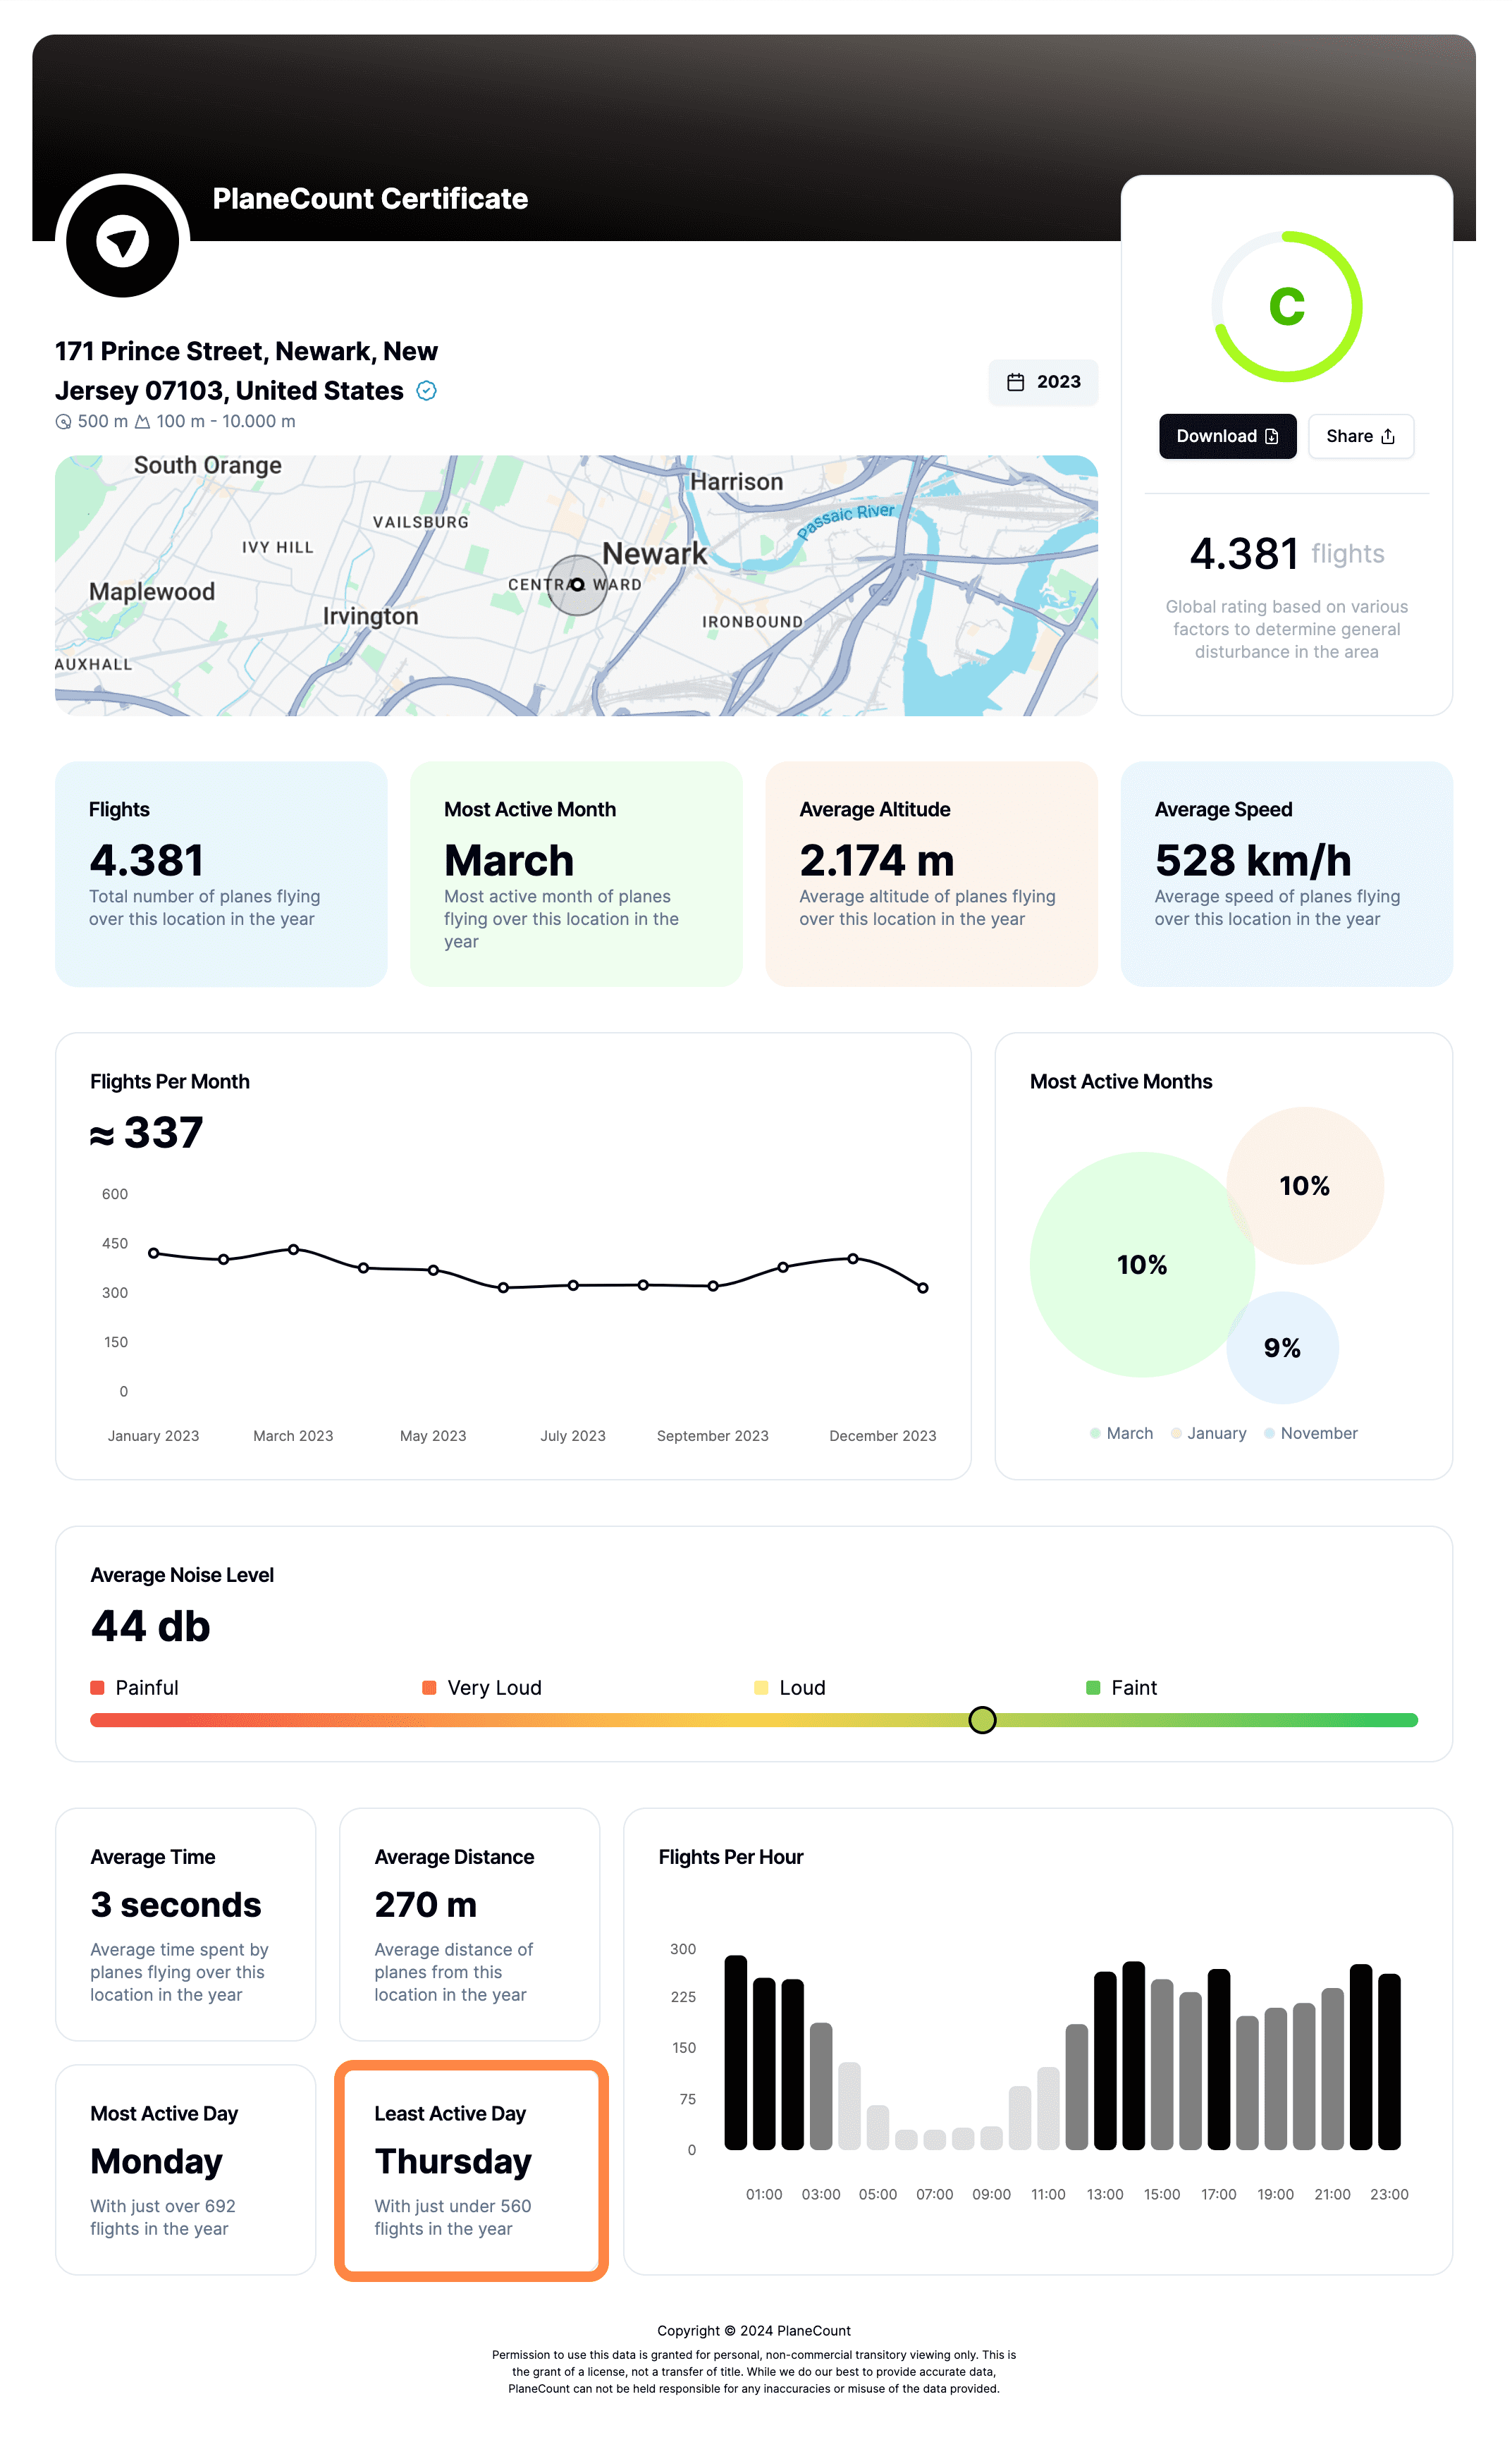
• Least active day
Discover the least active day in the week for this location.
• Flights per hour
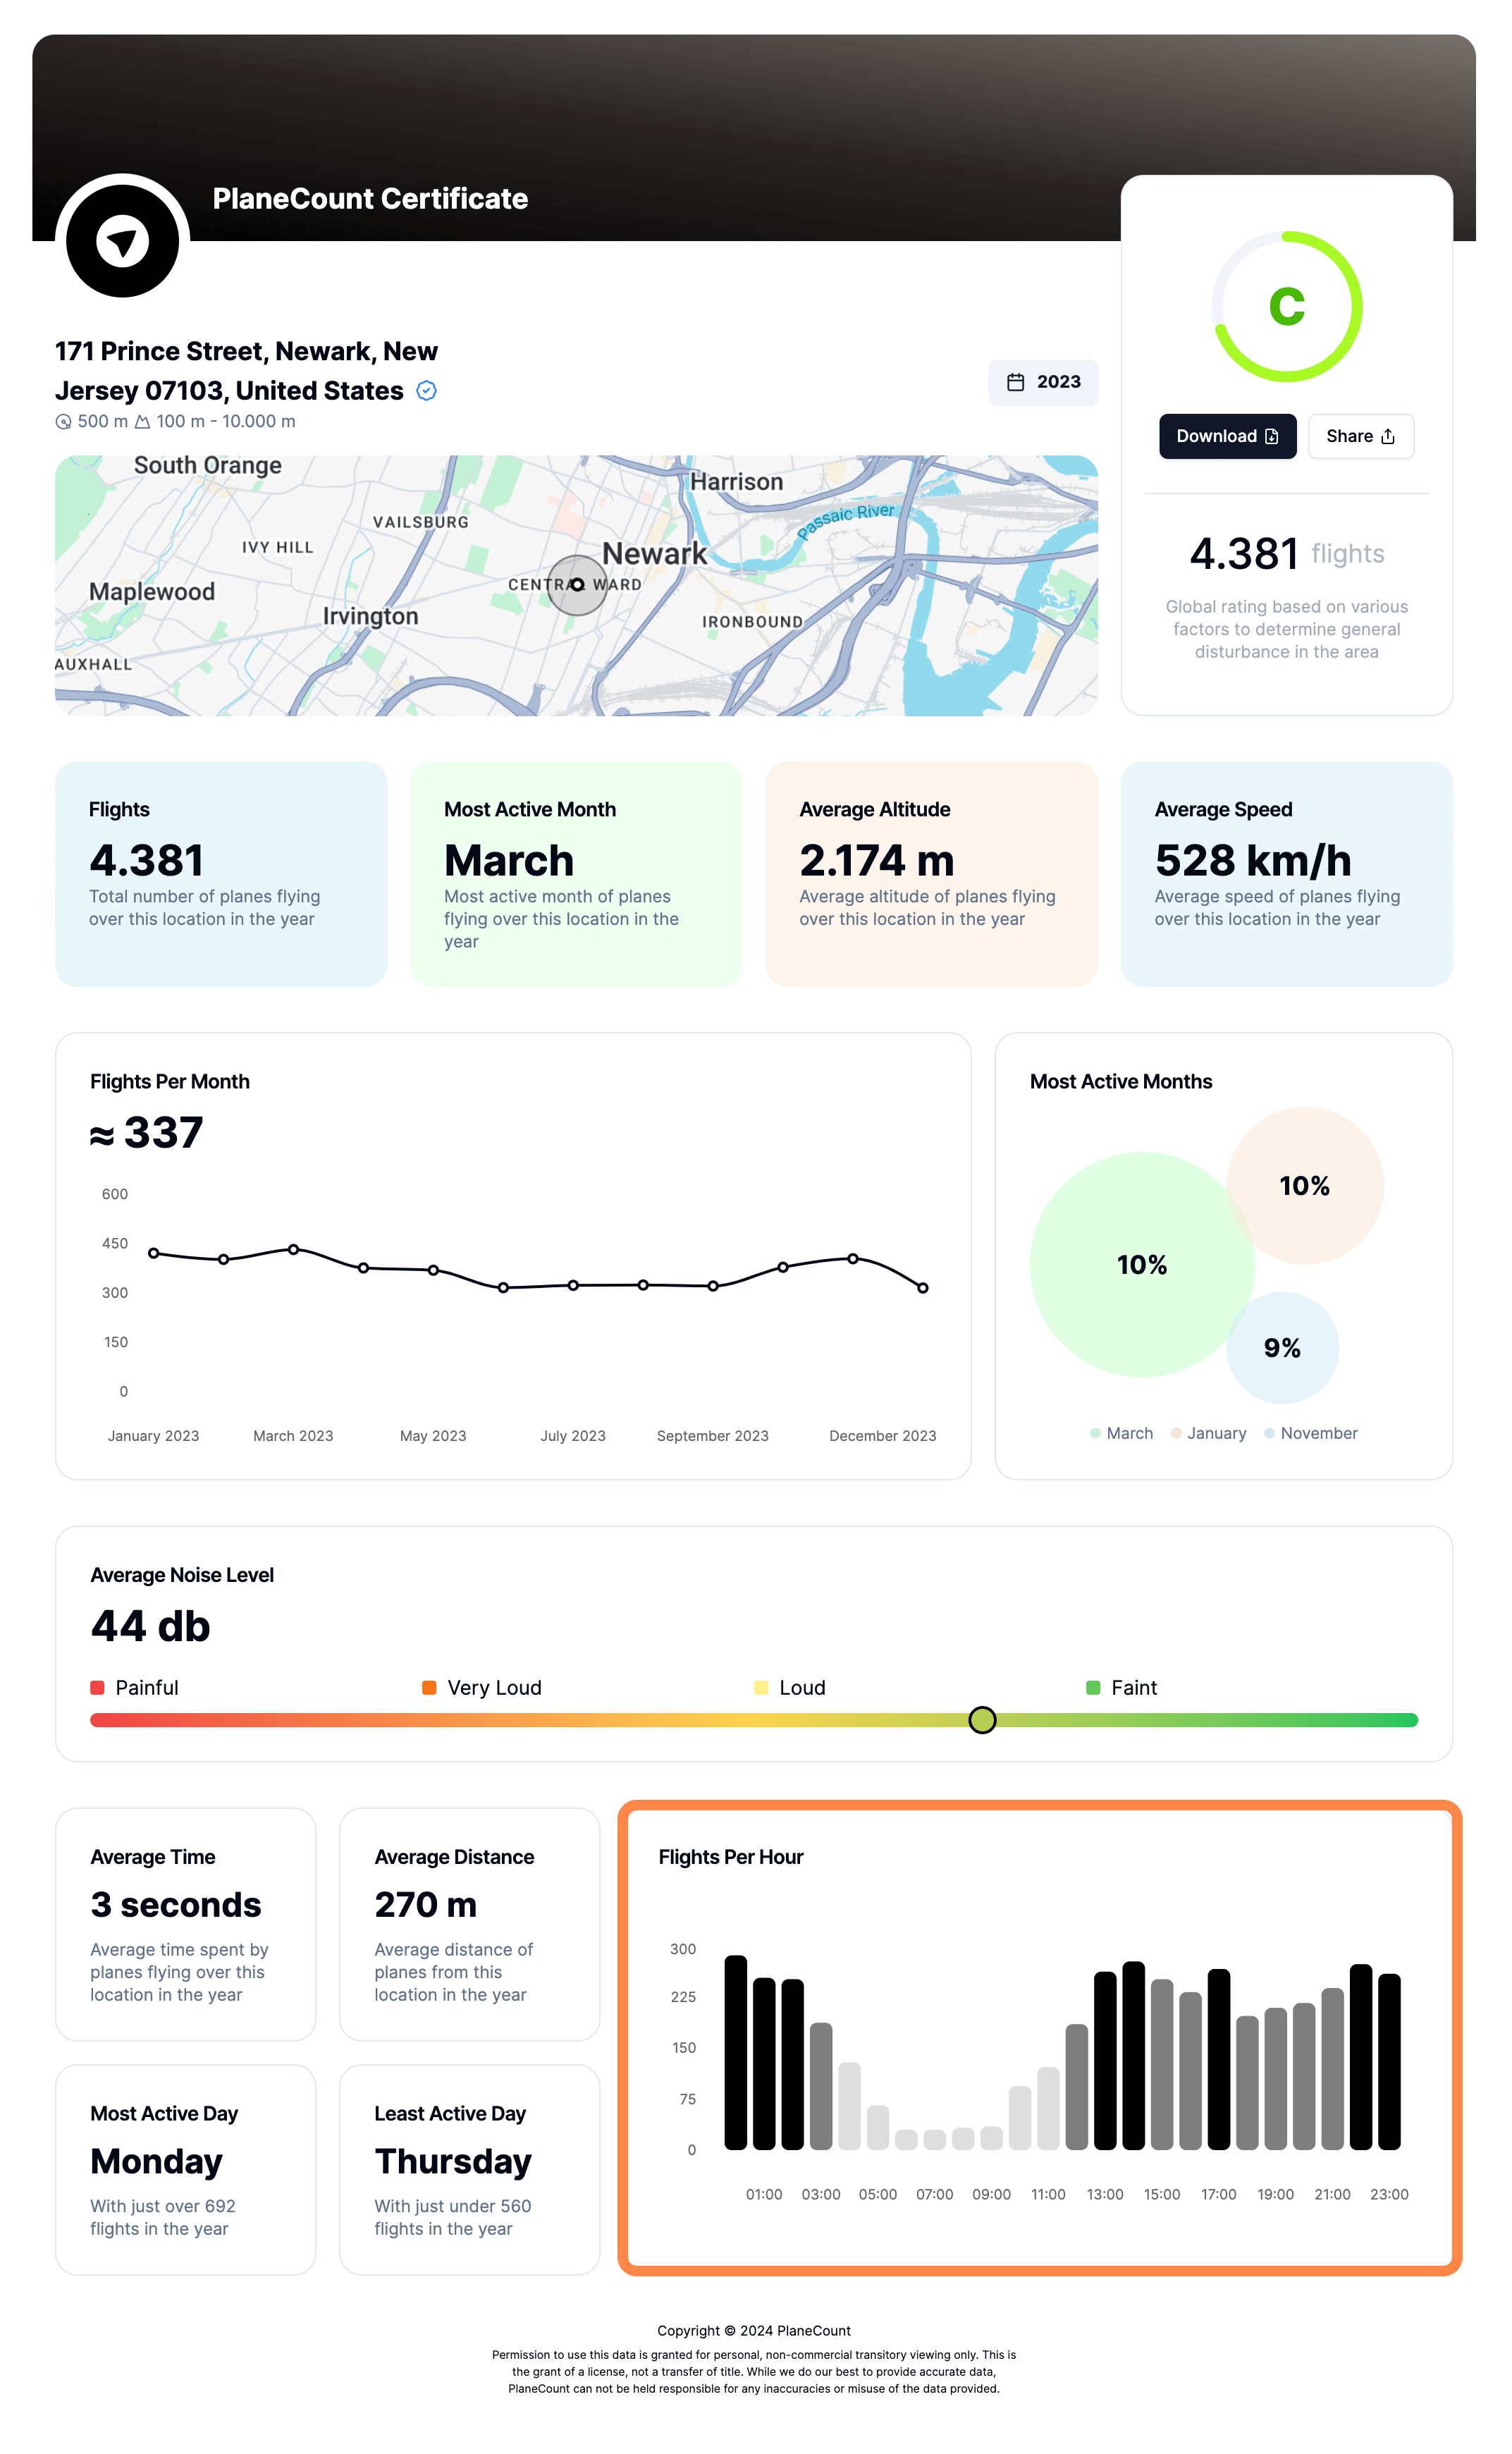
Discover the most active hour.
